WIPP-Drucker Model: Comparison with Drucker-Prager Model
Note
To view this project in FLAC3D, use the menu command . Choose “Creep/ComparisonWIPPDrucker” and select “ComparisonWIPPDrucker.prj” to load. The project’s main data files are shown at the end of this example.
The viscoplastic WIPP-Drucker model is compared to the elastopalstic Drucker-Prager model. If creep is inhibited in the viscoplastic model, the same behavior is exhibited in both models.
This exercises the WIPP-Drucker model and the Drucker-Prager model by applying a complex strain history to both and comparing corresponding histories of all stress components. The maximum discrepancy (normalized to the maximum recorded stress component) is printed at the end. It is found that the maximum normalized discrepancy is 0.007%, which is within the bounds of machine accuracy. Note that creep is active throughout the simulation, but the effects of creep are small because the timestep (\(\Delta t\)) is set to 0.1 second. If the simulation is continued, the mean stress becomes tensile. In this case, the apparent discrepancy increases to 0.1%, but this is simply due to the fact that the two models are alternating between shear and tensile yield at different points in time.The result is plotted in Figure 1.
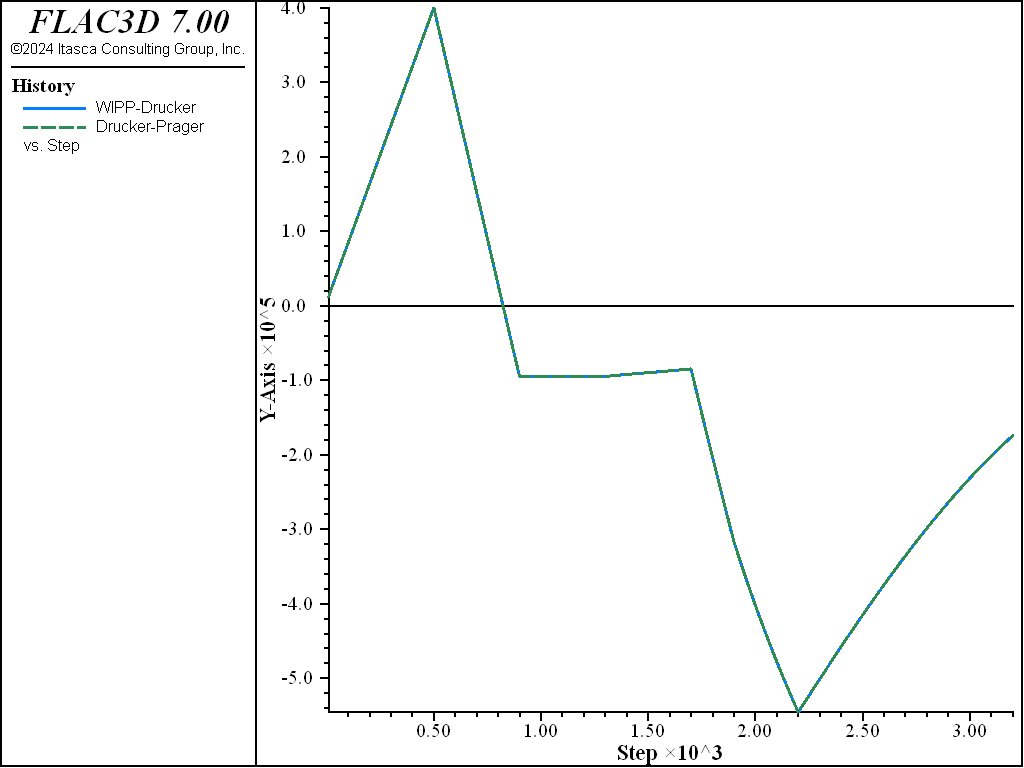
Figure 1: Comparison of stress between the WIPP-Drucker and Drucker-Prager models with \(\Delta t = 0.1\) s.
The model is repeated with timesteps of 10 and 20 seconds; the effects of creep will be increasingly more significant in comparison with plasticity effects. The results are plotted in Figure 2 and Figure 3, respectively. There is a general decay of stress components relative to the Drucker-Prager model stress components when creep is active.
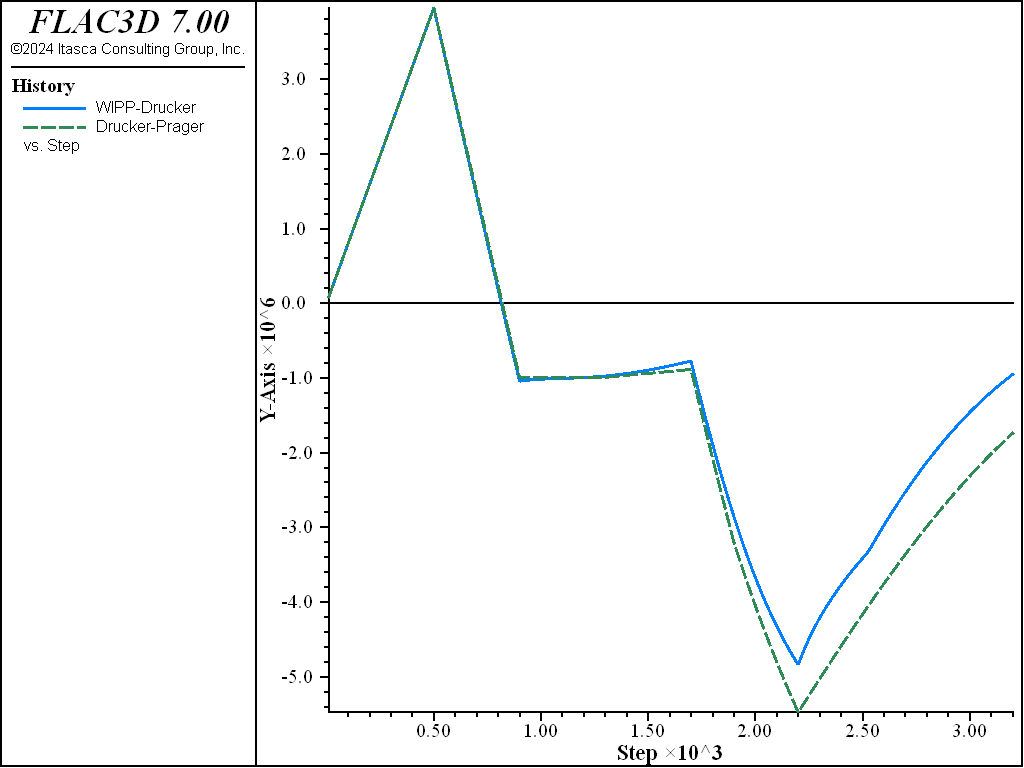
Figure 2: Comparison of stress between the WIPP-Drucker and Drucker-Prager models with \(\Delta t = 10\) s.
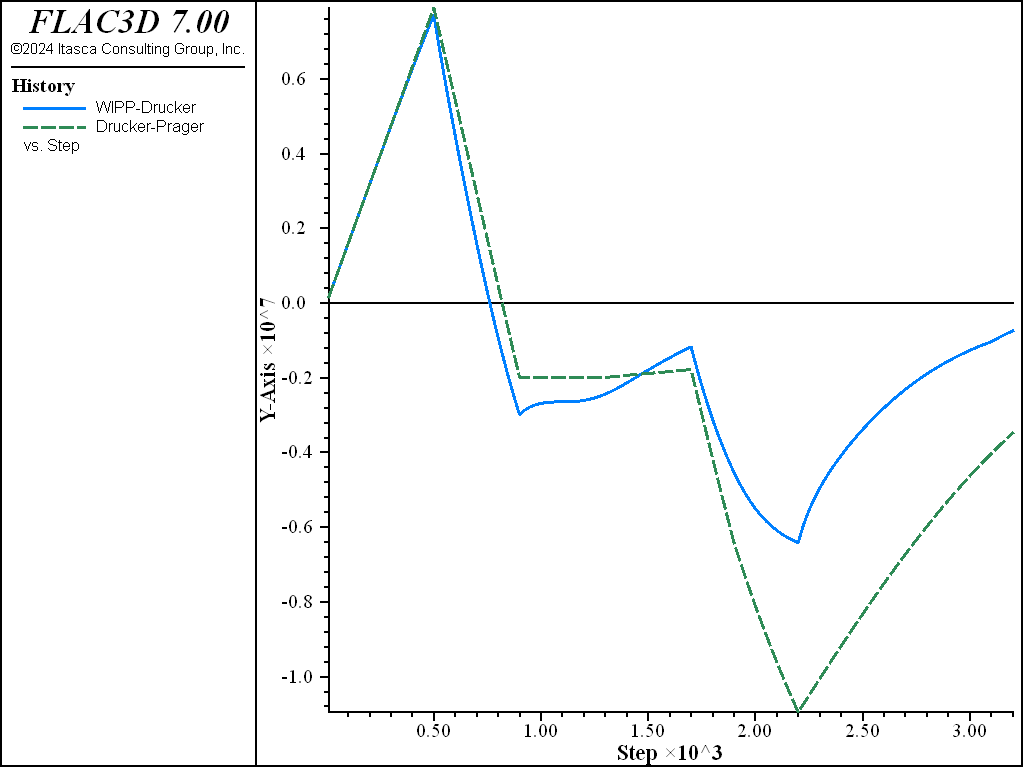
Figure 3: Comparison of stress between the WIPP-Drucker and Drucker-Prager models with \(\Delta t = 20\) s.
Data File
;------------------------------------------------------------------
;       Comparison of the WIPP-Drucker and Drucker-Prager models
;-------------------------------------------------------------------
model new
model large-strain off
fish automatic-create off
model title "Comparison of the visco-plastic and Drucker-Prager models"
;
model configure creep
zone create brick size 2 1 1
;
zone cmodel wipp-drucker range position-x 0 1
;---> common properties
zone property shear 12.4e9 bulk 20.7e9 tension 1e15 friction-drucker 0.5 ...
              dilation-drucker 0.3 cohesion-drucker 1e4 range position-x 0 1
zone cmodel assign drucker-prager range position-x 1 2
;---> common properties
zone property shear 12.4e9 bulk 20.7e9 tension 1e15 friction-drucker 0.5 ...
              dilation-drucker 0.3 cohesion-drucker 1e4 range position-x 1 2

;---> PWIPP-specific properties
zone property constant-gas 1.987 activation-energy 12e3 exponent 4.9 ...
              constant-d 5.79e-36 constant-a 4.56 constant-b 127 ...
              creep-rate-critical 5.39e-8 temperature 300 range position-x 0 1
;
zone gridpoint fix velocity
zone initialize stress xx 100 yy 100 zz 100
zone initialize density 2600
program call 'fishFunctions'
model history creep time-total
zone history stress-xz position .5 .5 .5
zone history stress-xz position 1.5 .5 .5
fish history w_error
fish history sig_0_w
fish history sig_0_d
fish history s_level
model save 'ini'

model creep timestep fix 1.0 ; 10 ; 20
program call 'loadPath'
model save 'dt01'

model restore 'ini'
model creep timestep fix 10.0
program call 'loadPath'
model save 'dt10'

model restore 'ini'
model creep timestep fix 20.0
program call 'loadPath'
model save 'dt20'
⇐ Burgers-Mohr/Power-Mohr Model: Loading/Unloading Compression Test | WIPP-Drucker Model: Compression Test Showing Localization ⇒
| Was this helpful? ... | FLAC3D © 2019, Itasca | Updated: Feb 25, 2024 |