Zone Plot Item
Description
Show zone information by label or value. The first few attributes of this plot item are contingent on the first attribute (Color By).
Attributes
Color-By Label/Value Color-List/Contour Highlight Selected Selected Only Null Faces Hide-Null Map Def-Fac Polygons Transparency Legend
Color By

Set either a “label” or a “contour” to be colored on the plot item.
Label/Value
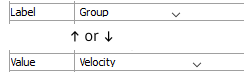
Specify which label or value (as determined by the previous setting) to display in the plot item. The options for both are shown on the following table. Some options will require additional, dynamically-provided attributes in order to complete the selection; these are indicated with notations on the table.
Table 1: Selection Options for Label/Value Label
Valueᴸ
Value (cont.)
Density
Accelerationᶜ
Multiplier
Extraᵉ
Conditionᵐ
Pore Pressureʷ
Face Extraᵉ
Convergence
Propertyᵖᵐ
Face Groupsˢ
Densityᵐ
Saturation
Fluid Density
Displacementᶜ
Strain Incrementʸ
Fluid Property
Dynamic Timestep
Strain Rateʸ
Groupˢ
Effective Stressᶻ
Stressᶻ
Model
Extraᶠ
Strength-Stress Ratioᵐ
Multiplier
Fluid Biot Modulus
Target-Force Ratio
Propertyᵖ
Fluid Bulk Modulus
Temperature
Stateᵗ
Fluid Densityᵐ
Thermal Propertyᵖᵐ
Thermal Propertyᵖ
Fluid Propertyᵖᵐ
Unbalanced Forceᶜ
Type
Local Force Ratio
Velocityᶜ
Uniform
Key:
ᴸ*All* values provide a “Log” attribute
ᶜA “Component” attribute follows
ᵉAn “Extra” attribute follows
ᶠAn “Extra” and “Type” attribute follow
ᵐA “Method” attribute follows
ᵖA “Property” attribute follows
ˢA “Slot” attribute follows
ᵗA “State By” attribute follows
ʷA “Source” attribute follows
ʸA “Quantity” and “Method” attribute follow
ᶻA “Quantity”, “Stress”, and “Method” attribute follow
Color-List/Contour
The attribute appearing in this position is either a Color-List or a Contour, depending on the “Color By” selection. Refer to the standard color-list control description and the standard contour control description for details.
Highlight Selected

Display highlighted items.
Highlight Selected: Indicate (checked) selected elements of the plot item within the plot.
Selected Only

Set which elements are shown.
Selected Only: Specify (checked) that only selected plot item elements should be rendered.
Null Faces

Show a face boundary between null and not-null zones.
Null Faces: Show only faces (checked) with nulled zones on the other side.
Hide-Null
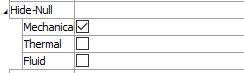
Do not show null items in the plot. See the standard hide-null control description for details.
Map
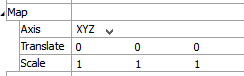
Map the item to new model coordinates. See the standard map control description for details.
Def-fac

Set the deformation factor. See the standard def-fac control description for details.
Polygons

Set properties of item facets. See the standard polygons control description for details.
Transparency
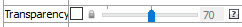
Set the transparency of the plot item. See the standard transparency control description for details.
Legend
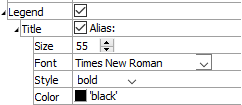
Set item labeling in the plot legend. See the standard legend control description for details.
Beneath Title, the Water Table plot item also provides controls in Legend for Map, Hide-Null, Def-Face, Color-List, and Count.
| Was this helpful? ... | Itasca Software © 2024, Itasca | Updated: Apr 02, 2024 |
