
Factor of Safety Contours
Problem Statement
Note
To view this project in FLAC3D, use the menu command . Choose “TheoryAndBackground/FactorOfSafety/ FOSContours” and select “FOSContours.f3prj” to load. The project’s main data files are shown at the end of this example.
Typically, application of the strength reduction method produces one single factor of safety per simulation, corresponding to one global minimum stability state. However, the ability to calculate multiple minimum states may be of interest, for example, along a complex slope profile such as a benched cut or a slope with a berm (e.g., see Cheng et al. 2007). A “safety map” may be constructed through a series of analyses using the limit equilibrium method to identify multiple possible failure surfaces for slopes of this type (Baker and Leshchinsky 2001).
A simple procedure to determine multiple local stability states with the strength reduction method is to exclude different regions of the slope when performing the strength reduction calculation.
Alternatively, the explicit dynamic solution method employed in FLAC3D allows multiple local
stability surfaces to be identified in one FLAC3D simulation. When using the
model factor-of-safety command, model instability is detected by monitoring the
unbalanced force ratio throughout the model. This provides a minimum global factor of safety for
the model. In an alternative technique, presented here, material strengths are reduced in
increments by a strength reduction factor. Unstable states for the model are identified at the
global minimum state and then beyond that state. Unstable states of the model are identified at
each stage as an assembly of gridpoints with velocities above a specified average value. The
current strength reduction factor is assigned to unstable gridpoints for later contouring.
If the strength is reduced in small intervals, progressively more regions of gridpoints can be identified as unstable. By monitoring the velocities, it is possible to delineate the regions of unstable gridpoints by different strength factors and produce a plot of factor of safety contours. This plot can be used to locate multiple possible failure surfaces and is comparable to the safety map developed using the limit equilibrium method.
This technique is demonstrated for a slope profile consisting of two double-inclination slopes separated by a horizontal berm. This example is taken from Cheng et al. (2007), who produced a set of local minimum stability states for this slope using the Morgenstern-Price limit equilibrium method. The slope configuration and resulting local minima locations are shown in Figure 1.
FLAC3D Model
The slope geometry is drawn in the Extrusion pane, and the extruded-grid input record is saved
as data file “geometry.f3dat”. The slope is oriented in the x-z plane and is one
zone thick in the y-direction. The mesh density is specified with the
extrude set automatic-zone command.
A FLAC3D simulation is first run to determine the global minimum factor of safety for this
slope using the model factor-of-safety command. The result, shown by the shear strain
contour plot in Figure 2, is a global minimum factor of safety of 1.32
with a multiple failure surface that corresponds to the two surfaces with the smallest factor of
safety values shown in the lower slope in Figure 1.
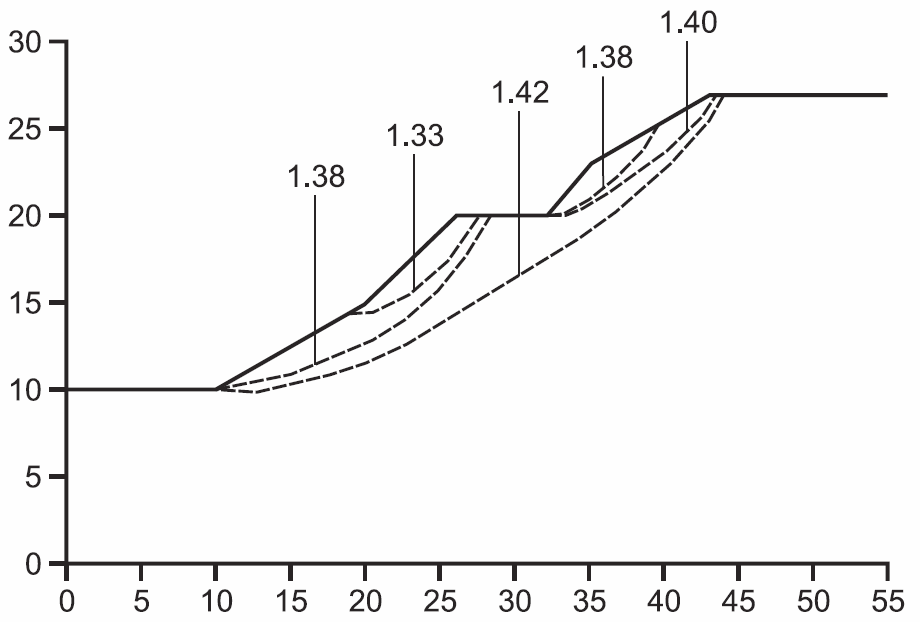
Figure 1: Local minima surfaces from limit equilibrium solution for slope with beam (from Cheng et al. 2007).
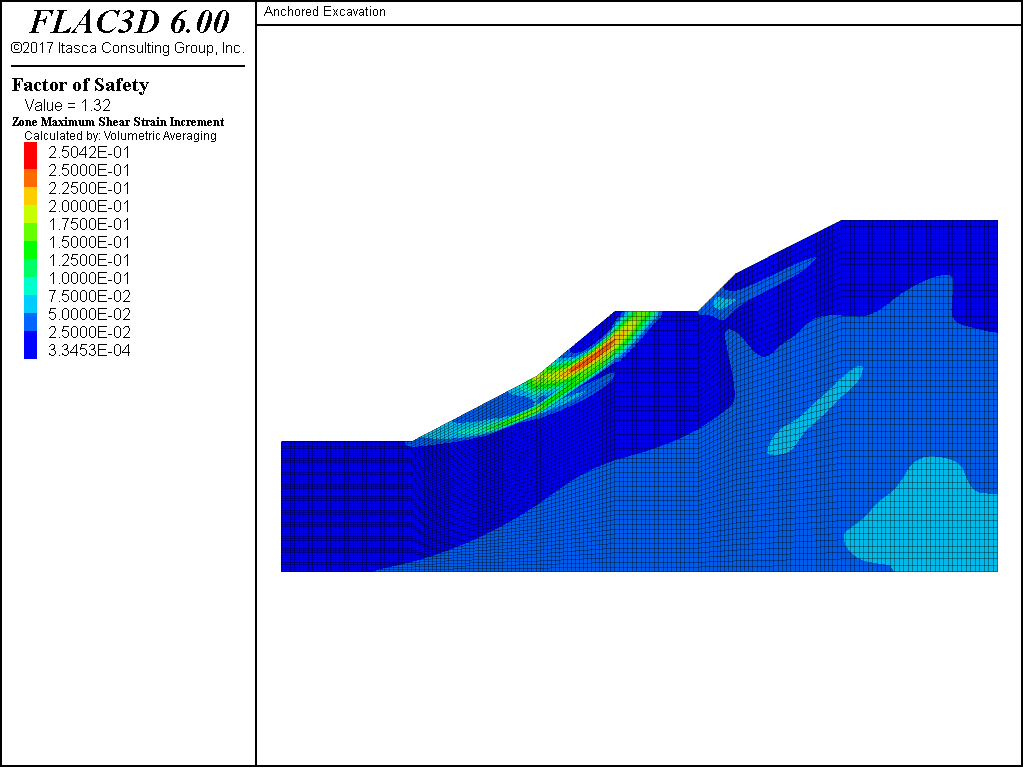
Figure 2: Global minimum factor of safety for slope with berm.
The safety factor from the model factor-of-safety command identifies the starting factor
to develop a set of factor of safety contours for this model. Factor of safety contours are
calculated for this slope model by using the FISH function defined in
“FOSContours.f3dat”. This function reduces the Mohr-Coulomb
strengths, cohesion, and friction incrementally. A stable or new unstable state is determined at
each strength-reduction increment, and if the state is unstable, the portion of the model that
is failing is identified by evaluating gridpoint velocities. New gridpoints with velocities
greater than a specified value are identified as failing and are assigned the current
strength-reduction increment factor, which is stored in the gridpoint in extra variable
1. After the simulation is complete for the selected range of strength-reduction
increments, a contour plot of gridpoint extra 1 values is produced. This is a factor of
safety contour plot.
The values input as arguments for the FOSContour function are the starting value for strength reduction, fsmin, the limiting velocity threshold for a gridpoint at failure, vel�_limit, the reduction factor increment, inc�_fs, the cycle limit for each stage, max�_num�_cyc, the number of stages to calculate, total�_stages, and a flag indicating whether tension should be included in the strength reduction, inc�_tension. For this example, fsmin = 1.1, inc�_fs = 0.05, max�_num�_cyc = 30000, vel�_limit = 10-4, total�_stages = 10, and inc�_tension = false. The maximum cycle limit and velocity limit are problem dependent; their values may be selected after trial runs with strength properties reduced to determine the velocity magnitude level at which failing gridpoints are well defined.
The factor of safety contour plot produced for this example is shown in Figure 3. The contours compare quite well with the local minima surfaces plot in Figure 1. Note that the global minimum contour line (at a factor of 1.3) in Figure 3 closely matches the smallest local minimum surface in Figure 1. The next contour lines, at factors of 1.35 and 1.4 below and above the berm, also compare well with the failure surfaces identified in Figure 3. The factor of safety contour plot also shows a contour shape (see, for example, the 1.45 contour in Figure 3) that curves upward beneath the berm. Note that this effect on the shape of the failure surface is not seen with the limit equilibrium method; compare to the 1.42 surface in Figure 1.
This exercise demonstrates that the strength reduction method can be applied to produce multiple potential failure surfaces in one simulation by monitoring failure in terms of the development of unstable regions (defined by high gridpoint velocities) as the strength of the material is incrementally reduced.
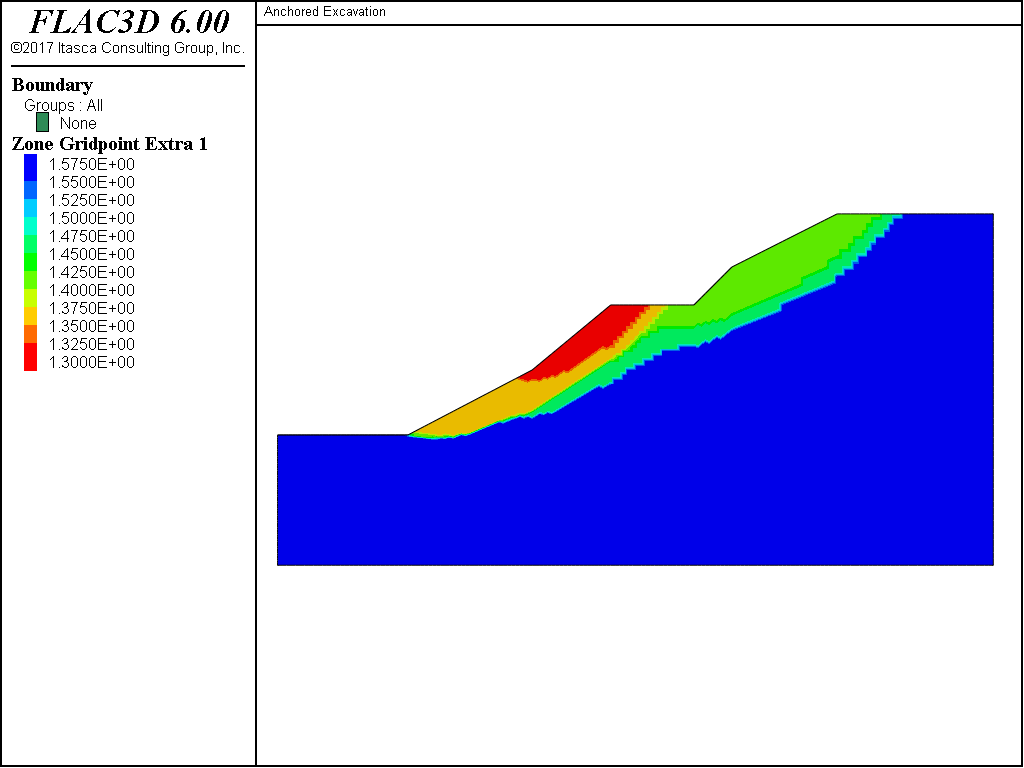
Figure 3: Factor of safety contours for slope with berm.
References
Baker, R., and D. Leshchinsky. “Spatial distribution of safety factors,” J. Geotech. Geoenviron. Eng., 127(2), 135-45 (2001).
Cheng, Y.M., T. Lansivaara and W.B. Wei. “Two-dimensional slope stability analysis by limit equilibrium and strength reduction methods,” Computers and Geotechnics, 34, 137-150, 2007.
Data Files
BermFOS.f3dat
model new
model largestrain off
; Geometry created in 2D extruder, exported from state record.
call 'geometry' suppress
extrude set automatic-zone direction construction size 160
zone generate from-extrude
zone face skin ; Label model boundaries
; Assign constitutive model and properties
zone cmodel assign mohr-coulomb
zone property bulk 6.25e6 shear 2.88462e6 density 2000
zone property cohesion 5000 friction 30 tension 1e100
; Assign boundary conditions
zone face apply velocity-normal 0 range group 'East' or 'West'
zone face apply velocity-normal 0 range group 'North' or 'South'
zone face apply velocity (0,0,0) range group 'Bottom'
model gravity 10
model solve elastic ratio-local 1e-4
model save 'initial'
; Solve for initial factor-of-safety
model factor-of-safety ratio-local 1e-3 filename 'Berm'
BermFOSContours.f3dat
model restore 'initial'
;
zone gridpoint initialize displacement (0,0,0)
zone gridpoint initialize velocity (0,0,0)
call 'FOSContours' suppress
@FOSContours(1.1,1e-4,0.05,30000,10,[false])
model save 'FOSContours'
FOSContours.f3dat
fish automatic-create off

; fsmin        = Starting minimim safety factor
; vel_limit    = Threshold velocity below which a given gridpoint
;                is considered stable
; inc_fs       = Amount safety factor is increment each stage
; max_num_cyc  = Number of cycles that is taken at each stage
; t_stages     = Total stages taken - maximum safety factor is then
;                fsmin + (total-stages-1)*in_fs
; inc_tens     = If true, then tension is included in the
;                general strength reduction
fish define FOSContours(fsmin,vel_limit,inc_fs,max_num_cyc,t_stages,inc_tens)
    ; Initialize storage in zones and gridpoints
    loop foreach local gp gp.list
        gp.extra(gp,1) = 0
    end_loop
    loop foreach local zone zone.list
        zone.extra(zone,1) = zone.prop(zone,'cohesion')
        zone.extra(zone,2) = zone.prop(zone,'friction')
        zone.extra(zone,3) = zone.prop(zone,'tension')
    endloop
    ; Loop through stages of target safety factor
    local k = 0
    local numb = 0
    loop while k < t_stages
        ; Calculate safety factor for stage, and reduce cohesion, friction,
        ; and tension accordingly
        local fs = fsmin + k*inc_fs
        loop foreach zone zone.list
            zone.prop(zone,'cohesion') = zone.extra(zone,1) / fs
            zone.prop(zone,'friction') = ...
            math.atan(math.tan(zone.extra(zone,2)*math.degrad)/fs)/math.degrad
            if inc_tens then
                zone.prop(zone,'tension') = zone.extra(zone,3)/fs
            endif
        endloop
        ;
        local num_cyl_0 = global.step
        command
model solve cycles @max_num_cyc ratio-local 1e-3
        endcommand
        loop foreach gp gp.list
            if gp.extra(gp,1) = 0 then
                local vel = math.mag(gp.vel(gp))
                if vel > vel_limit then
                    gp.extra(gp,1) = fs - inc_fs
                endif
            endif
        endloop
        if (global.step-num_cyl_0) > max_num_cyc then
           numb = numb + 1
        endif
        k = k + 1
    endloop
    loop foreach gp gp.list
        if gp.extra(gp,1) = 0 then
           gp.extra(gp,1) = fs + inc_fs/2.0
        endif
    endloop
end
| Was this helpful? ... | PFC 6.0 © 2019, Itasca | Updated: Nov 19, 2021 |