
Strength of a Face-Centered Cubic Array of Spheres
| Problem Resources | |
|---|---|
| Data File | Project: Open “ArrayStrength.p3prj” in PFC3D [1] |
Problem Statement
In this problem, the strength of a face-centered cubic array of uniform spheres is determined numerically under axial-symmetry and plane-strain conditions. The array is represented in Fig. 1 and Fig. 2 below. The balls are rigid and have a friction coefficient of 0.3 (corresponding to a friction angle of about 17°). The test results are compared to the analytical solution of [Thornton1979].
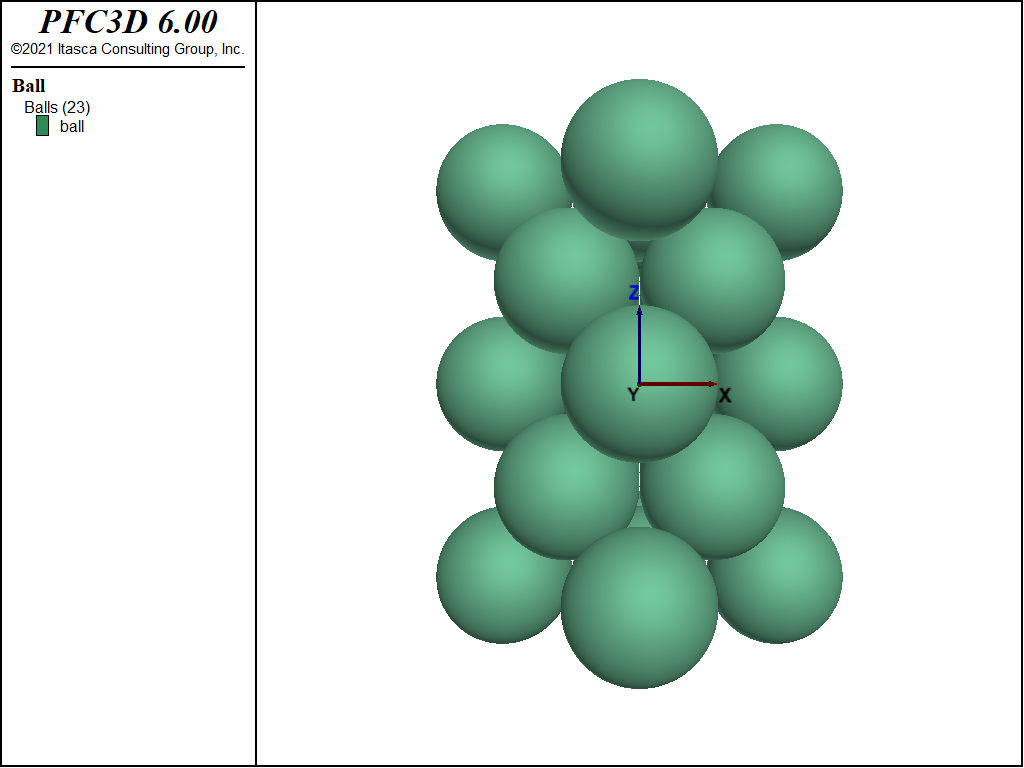
Figure 1: Geometry of face-centered cubic array of spheres, plan view.
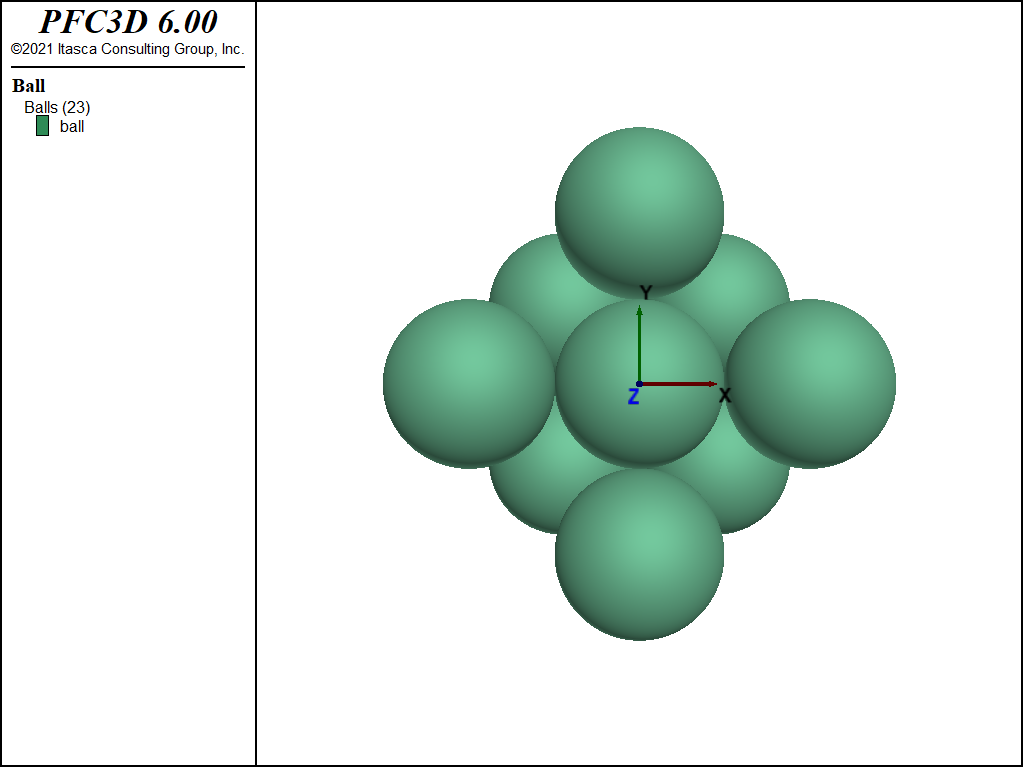
Figure 2: Geometry of face-centered cubic array of spheres, elevation.
Closed-Form Solution
The form of the average stress tensor at failure within a typical sphere has been determined analytically by [Thornton1979] under homogeneous conditions. The failure mechanism, characterized by the formation of gaps along two perpendicular planes, is associated with a normalized strain-increment tensor of the form
where \(a + b =\) 1, and the reference axes are defined in Fig. 1.
The definition of the average stress tensor in terms of contact forces is the same as that used in PFC3D. In the case where the shear components can be neglected, the stress tensor may be expressed, up to a scalar multiplication factor, in the form
where \(f\) is the friction coefficient, and the constant, \(C\), is defined by the relation
In axisymmetric conditions, \(a = b = 0.5\), and the ratios of principal stresses at failure, defined as strength measures, are found to be
In plane-strain conditions, \(a =\) 1, \(b =\) 0, and the strength is measured by the following ratios:
PFC3D Model
The numerical model configuration consists of an assembly of 23 balls with common radius, \(r\), as depicted in Fig. 1 and Fig. 2 above. For easy reference, we use the terms outer-\(x\), outer-\(y\) and outer-\(z\) to indicate the balls with origin at \(|x| = 2r\), \(|y| = 2r\), and \(|z| = 2\sqrt{2r}\), respectively. All balls have the same properties:
| density | 2000 | \([M/L^3]\) |
| normal stiffness | 5 × 10¹¹ | \([M/T^2]\) |
| shear stiffness | 5 × 10¹¹ | \([M/T^2]\) |
| friction coefficient | 0.3 | |
| radius | 20 | \([L]\) |
The lateral boundary conditions of the test are prescribed as follows. In both axisymmetric and plane-strain conditions, compressive forces of the magnitude \(F\) are applied to the outermost balls in the \(x\)-direction. Compressive forces of the same magnitude \(F\) are applied to the outermost balls in the \(y\)-direction in the axisymmetric test, while the \(y\)-velocity is fixed to zero in the plane-strain test. The axial conditions are prescribed, in turn, by means of imposed compressive velocity in the \(z\)-direction to the outer-\(z\) balls.
In the numerical experiments, the velocity of the top and bottom balls is first fixed to zero, the ball friction coefficient is set to a low value of \(1 × 10^5\), the lateral boundary conditions are applied using \(F =1 \times 10^6\) in both the axisymmetric and plane-strain tests, and the system is cycled to equilibrium. The ball friction coefficient is then set to 0.3. A compressive velocity of magnitude \(|v_z|= 0.5 \times 10^4\) is applied to the outer-\(z\) ball in the \(z\)-direction, and failure of the system is monitored using a plot of principal stress histories in terms of a measure of strain in the \(z\)-direction. Ball rotations are fixed throughout the tests. Failure is identified on the \(σ_{zz}\) plot by a peak in the stress-strain curve. Records of the stress ratio at that time are used to provide numerical values for the comparison.
Results and Discussion
A comparison of the numerical test results with the analytical predictions derived from Equations (4) and (5), using \(f = 0.3\), is presented in Table 3 and Table 4. The agreement is good, with a relative error of less than 1% for both the axisymmetric and the plane-strain tests.
| Numerical | Analytical | Relative error | |
|---|---|---|---|
| \(\sigma_{zz} / \sigma_{xx}\) | 3.7142 | 3.7143 | < 1% |
| \(\sigma_{yy} / \sigma_{xx}\) | 1.0000 | 1.0000 | < 1% |
| Numerical | Analytical | Relative error | |
|---|---|---|---|
| \(\sigma_{zz} / \sigma_{xx}\) | 4.8809 | 4.8812 | < 1% |
| \(\sigma_{yy} / \sigma_{xx}\) | 1.9603 | 1.9604 | < 1% |
References
| [Thornton1979] | (1, 2) Thornton, C. “The Conditions for Failure of a Face-Centered Cubic Array of Uniform Rigid Spheres,” Géotechnique, 29 (4), 441-459 (1979). |
Endnote
| [1] | This file may be found in PFC3D under the “verification_problems/Array_Strength” folder in the Examples dialog ( on the menu). If this entry does not appear, please copy the application data to a new directory. (Use the menu commands . See the “Copy Application Data” section for details.) |
⇐ Data Files for “Measure Logic”
Problem |
Data File for “Strength of a Face-Centered Cubic Array of Spheres” Problem ⇒
| Was this helpful? ... | PFC 6.0 © 2019, Itasca | Updated: Nov 19, 2021 |