Single Zone Swell Test
Note
To view this project in FLAC3D, use the menu command . Choose “ConstitutiveModels/SingleZoneSwell” and select “SingleZoneSwell.prj” to load. The project’s main data file is shown at the end of this example.
In this example to test the swell model, a 2 m x 2 m single zone is generated, and the following elastic material properties are assigned: density = 1000 kg/m3; bulk modulus = 100 MPa; and shear modulus = 30 MPa. With roller boundary conditions enforced at the lateral and bottom boundaries, the model is settled under the gravity loading (g = 10 m/s2). At this point, the vertical stress \(\sigma_{z'z'}\) at the middle of elevation in the zone is equal to -10 kPa. In the next step, the displacements and velocities are reset in the model; the material model is switched from elastic to swell, which has the same stiffness and high strength (cohesion and tension). The swelling properties associated with the logarithmic function are listed in Table 1.
| Parameter | Value |
|---|---|
| density | 1000 |
| gravity (\(m/s^2\)) | 10 |
| \(K\) (Pa) | 1e8 |
| \(G\) (Pa) | 3e7 |
| \(\phi\) (deg) | 0 |
| \(c\) | 1e10 |
| \(\sigma^t\) | 1e10 |
| \((n_x, n_y, n_z)\) | (0,0,1) |
| \(p_a\) (Pa) | 1e5 |
| \(a_1\) | 1.5335 |
| \(c_1\) | -0.0187 |
| \(N_s\) | 200 |
Using the above parameters, an atmospheric pressure of 100.0 kPa, and logarithmic function for strains (flag-swell = 1), the swelling strain in the vertical direction obtained from the logarithmic function is 0.01523. Therefore, based on these analytical calculations, the zone swells upward by 0.03046 m. Numerical simulations are done with the data file provided below. The property \(N_s\) is set to 200, which means the swelling stress will be introduced into the zone over the next 200 steps. The model step and model solve command are used after 200 steps are taken to bring the model to equilibrium. Execution of the data file reports 0.03046 m swelling at the top surface, which exactly matches the analytical prediction.
The vertical displacement history at the zone top is plotted in Figure 1.
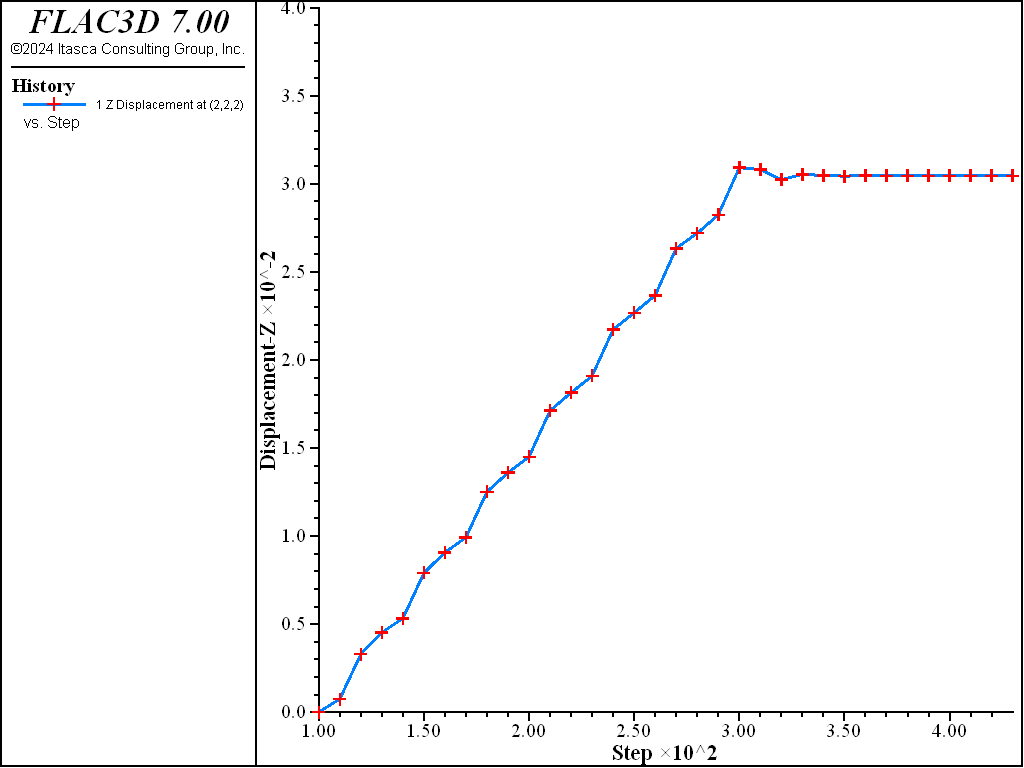
Figure 1: Vertical displacement at the zone top vs. steps.
Data File
SingleZoneSwell.dat
; single zone swelling test
model new
model large-strain off
model title "Single Zone test - Swell Model"
model gravity (0,0,-10)
;
zone create brick size 1 1 1 edge 2
zone face skin
zone cmodel assign elastic
zone property density 1000 bulk 1e8 shear 3e7
zone face apply velocity-normal 0 range group 'East' or 'West'
zone face apply velocity-normal 0 range group 'North' or 'South'
zone face apply velocity (0,0,0) range group 'Bottom'
model solve ratio-local 1e-5
;
zone gridpoint initialize displacement (0,0,0)
;
zone cmodel assign swell
zone property density 1000 bulk 1e8 shear 3e7 cohesion 1e10 tension 1e10
zone property normal (0,0,1) constant-a-1 1.5335 constant-c-1 -0.0187 ...
              pressure-reference 1e5 number-start 200
history interval 10
zone history displacement-z position (2,2,2)
model step 200
model solve ratio-local 1e-5
⇐ Oedometer Test with Plastic-Hardening Model | Single Zone Loading-Unloading Test with MohrT Model ⇒
| Was this helpful? ... | 3DEC © 2019, Itasca | Updated: Feb 25, 2024 |