Table Chart
Description
A 2D chart of one or more tables.
Attributes
Tables
Specifies which tables to include in the plot item.
X Axis (and Y Axis and Z Axis)
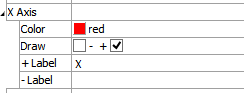
Provides control over the color, extent, and labeling of the \(x\)-axis portion of the plot item (controls are the same for the \(y\)-axis and the \(z\)-axis).
Color: Specifies the color of the axis.
Draw: Specifies whether the positive, negative, both, or neither arm of the axis is rendered.
+ Label: Specifies the text for the label to apply to the positive axis arm.
- Label: Specifies the text for the label to apply to the negative axis arm.
Y Axis
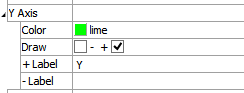
Provides control over the color, extent, and labeling of the y axis portion of the plot item.
Title
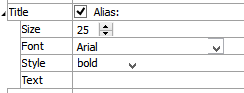
Control the titling of the plot item.
Title: Show (checked) the chart title at the top of the chart. Set the chart title by entering text in the “Alias:” field. This attribute also contains the following.
Size: Set the size of text in the title.
Font: Set the font face used for the text.
Style: Set the text style (the options are normal, bold, italic, bold-italic).
Labels
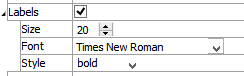
Control the appearance of labels on the item.
Marks
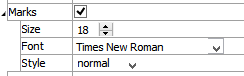
Controls appearance of axis marks.
Chart
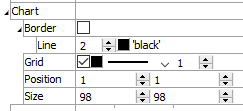
Set display options for the chart.
Chart: This is a container.
Border: Include (checked) the chart border.
Line: Set border line width and color.Grid: Include (checked) a chart grid at major tickmarks, and set color, line style, and width of the grid lines.
Position: Specifies the bottom and left positions, respectively, of the item’s bottom-left corner, as a percentage of the available rendering area.
If these values are set such that, with the current size setting, the item would exceed the available rendering area, then the size will be automatically downwardly adjusted to fit.
Size: Specify \(x\) and \(y\) size, respectively, of the item, as a percentage of the available rendering area. Also see the position attribute.
Transparency
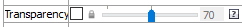
Set the transparency of the plot item. This setting is not available on 2D model objects.
Transparency: Apply transparency (checked) to the item. When on, transparency is set to a default value of 70 and is “locked.” When locked, the available range of transparency is constrained to 70 (lowest, somewhat transparent) to 100 (highest, completely invisible). To access the full range of transparency values (0-100), press the lock icon to “unlock” the transparency range; the icon changes accordingly (
).
Use the help button to get help with this specific attribute.
Note
Users should be cautioned that values lower than 70 tend to be imperceptibly “less” transparent and they may result in depth perspectives that can seem strange or incorrect.
Legend
Set display of the item in the plot legend. All plot items, at minimum, have a Title attribute.
Legend: Show (checked) all information about the plot item in the legend.
Title: Show (checked) the title of the plot item in the legend. The “Alias:” field may be used to specify a custom title for the item.
Size: Set the size of text in the legend.
Font: Set the font face used for the text.
Style: Set the text style (the options are normal, bold, italic, bold-italic).
Color: Set the text color.
| Was this helpful? ... | FLAC3D © 2019, Itasca | Updated: Feb 25, 2024 |