Undrained Triaxial Test with Soft-Soil Model
Note
The project file for this example is available to be viewed/run in FLAC3D.[1] The project’s main data files are shown at the end of this example.
The Soft-Soil model is used to simulate the triaxial consolidated-undrained (CU) tests with the consolidated stresses at 100, 80, 50, and 25 kPa. The pre-consolidated pressure (cap pressure) is assumed 100 kPa for all four cases, which corresponds to OCR = 1.00, 1.25, 2.00, and 4.00, respectively. The triaxial undrained compression is realized by setting zero volumetric strain, or the horizontal strains are setting to -0.5 times of the axial strain. The axial strain is up to 20%. The input parameters are summarized in the table:
| \(\lambda^*\) | 0.106 |
| \(\kappa^*\) | 0.016 |
| \(v\) | 0.25 |
| \(\phi\) | 30° |
| OCR | 1/1.25/2/4 |
Figure 1 plots the deviatoric shear stress (q) vs. the axial strain. All deviatoric stresses of the 4 cases increase and then remain constant values. The saturated deviatoric stress values are due to the load paths reaching the Mohr-Coulomb shear failure line, as shown in Figure 5, which plots the curves of q vs. p.
From Figure 2, for the case of OCR = 1, p is decreasing immediately after the undrained triaxial loading until it hits the Mohr-Coulomb shear failure line and the cap is expanding when q is increasing. For the case of OCR = 1.25, p remains constant until it reaches the cap; then p decreases until it reaches the Mohr-Coulomb shear failure line. For the cases of OCR = 2 and 4, p remains constant because the load paths reach the Mohr-Coulomb shear failure line before the cap. For the last two cases, the high OCR values prevent the undrained loading paths from reaching the cap.
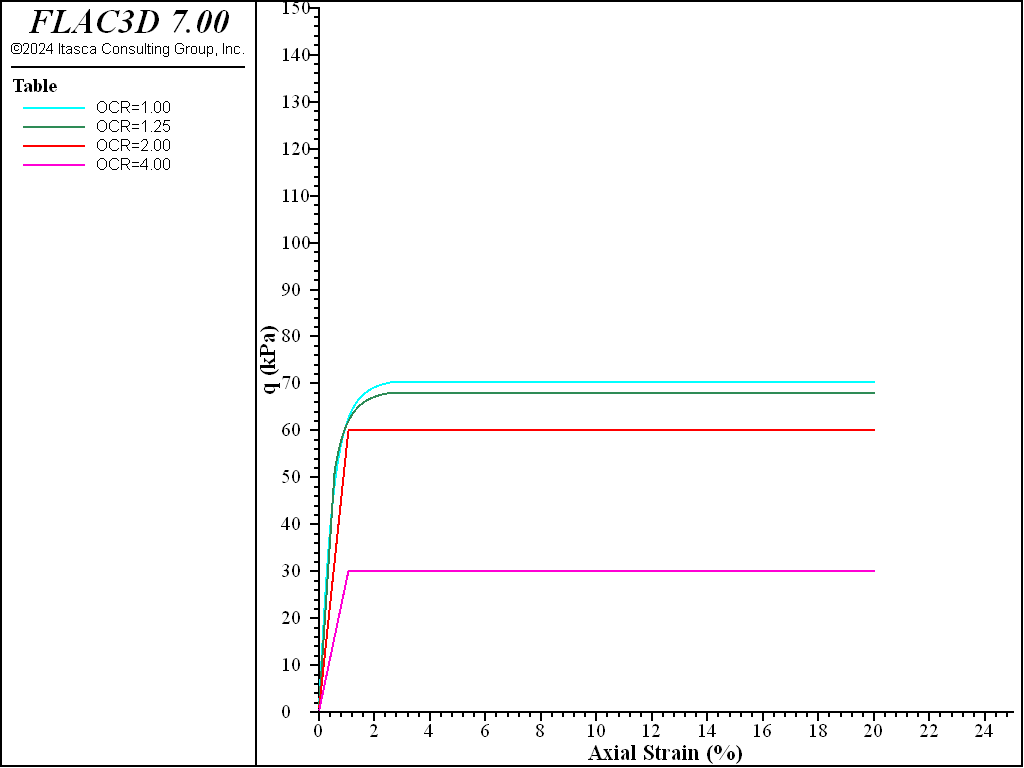
Figure 1: q vs. axial strain of triaxial CU compression tests for initial confining stress from 100 kPa (OCR=1.00), 80 kPa (OCR=1.25), 50 kPa (OCR=2.00), and 25 kPa (OCR=4.00).
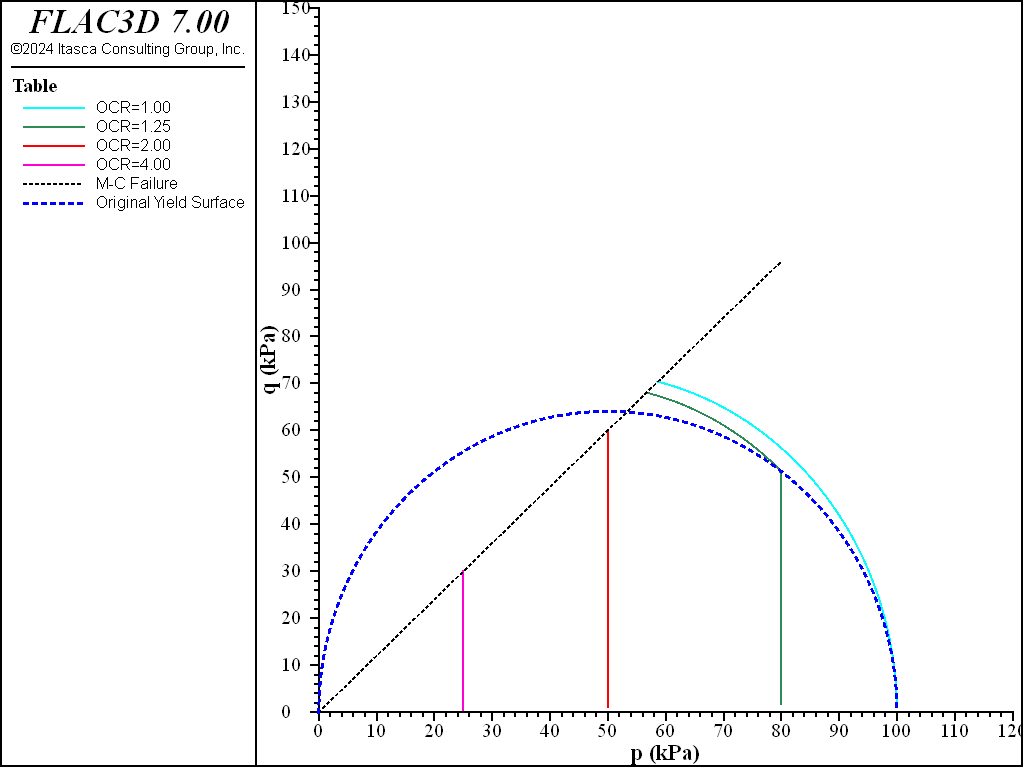
Figure 2: q vs. p of triaxial CU compression tests for initial confining stress from 100 kPa (OCR=1.00), 80 kPa (OCR=1.25), 50 kPa (OCR=2.00) and 25 kPa (OCR=4.00).
Data File
model new
model large-strain off
;
[global cs0  = -100.0]
[global totalsteps = 10000]
[global rate = 0.2/totalsteps]
[global ocr  = 1.00]
;
zone create brick size 1 1 1
zone face skin
zone cmodel assign soft-soil
zone property lambda-modified 0.106 kappa-modified 0.016 poisson 0.25
zone property coefficient-normally-consolidation 0.62 ...
              over-consolidation-ratio [ocr]
zone property friction=30.0 cohesion 0 dilation 0
zone property stress-1-effective=[cs0] stress-2-effective=[cs0] ...
              stress-3-effective=[cs0]
;
zone face apply velocity-x=0.0 range group 'west'
zone face apply velocity-y=0.0 range group 'south'
zone face apply velocity-z=0.0 range group 'bottom'
zone initialize stress xx [cs0] yy [cs0] zz [cs0]
;
[global zp = zone.head]
[global gp = gp.find(8)]
fish define q_
    global q_ = zone.stress.xx(zp) - zone.stress.zz(zp)
    global a_ = -gp.disp.z(gp)
    global strain_ = zone.strain.shear.inc(zp)
    global p_ = -(zone.stress.xx(zp) + zone.stress.yy(zp) + ...
                  zone.stress.zz(zp))/3.0
end
;
model history name 'steps' timestep
fish history name 'q' q_
fish history name 'a' a_
fish history name 'shearstrain' strain_
fish history name 'p' p_
;
zone face apply velocity-z [-rate] range group 'top'
zone face apply velocity-x [0.5*rate] range group 'east'
zone face apply velocity-y [0.5*rate] range group 'north'
;
model solve cycles [totalsteps]
;
history export 'q' vs 'a' table 'qa_ocr1p00'
history export 'q' vs 'p' table 'qp_ocr1p00'
table 'qa_ocr1p00' export 'qa_ocr1p00' truncate
table 'qp_ocr1p00' export 'qp_ocr1p00' truncate
;
model save 'triaxial_cu_ocr1p00_ss'
Endnotes
| [1] | To view this project in FLAC3D, use the program menu.
⮡ FLAC |
⇐ Single Zone Loading-Unloading Test with MohrT Model | Undrained Triaxial Test with NorSand Model ⇒
| Was this helpful? ... | FLAC3D © 2019, Itasca | Updated: Feb 25, 2024 |