Simple Test of Liner-Block Interface Behavior
Problem Statement
Note
The project file for this example may be viewed/run in 3DEC.[1] The data files used are shown at the end of this example.
A liner is placed on top of a soil block and then moved in various directions. The normal and shear stress and displacement of one of the liner coupling springs is monitored and plotted to demonstrate the effects of the liner-block interface properties on system response.
The 3DEC model is a one cubic meter block of soil composed with a 0.33 m2 concrete liner composed of 8 liner elements centered on top of the soil block, as shown in Figure 1. The soil is assigned elastic properties (\(E\) = 15 MPa, \(\nu\) = 0.3). The liner material is assigned properties corresponding with a 0.1 m thick concrete liner (\(E\) = 25 GPa, \(\nu\) = 0.15, \(t\) = 0.1 m). The liner-block interface properties (\(k_n\), \(k_s\), \(f_t\), \(c\), \(c_r\), \(\phi\)) are assigned as follows.
The interface stiffnesses (\(k_n\) and \(k_s\)) are set equal to 8 × 10⁸ N/m3 to ensure small interface deformation using the liner-stiffness equation. The following interface strength properties are assigned:
tensile strength (\(f_t\)) |
4 MPa |
cohesion (\(c\)) |
4 MPa |
residual cohesion (\(c_r\)) |
2 MPa |
friction angle (\(\phi\)) |
20 degrees |
In order to demonstrate the liner-zone interface behavior, the following conditions are imposed. The velocities of all gridpoints and nodes are fully fixed. The same velocities are applied to all nodes such that the liner moves as a rigid body. These conditions prevent internal stresses from developing in both the zones and the liner material; only the liner-zone interface springs are being exercised. The normal and shear stress and displacement at the center coupling spring is monitored and plotted. In the plots of normal stress versus normal displacement, the sign convention is that compression and overlap are positive (to correspond with the figure representing normal interface behaviors). In the plots of shear stress versus shear displacement, the magnitude of both shear stress and shear displacement are plotted (to correspond with the figure representing shear interface behaviors).
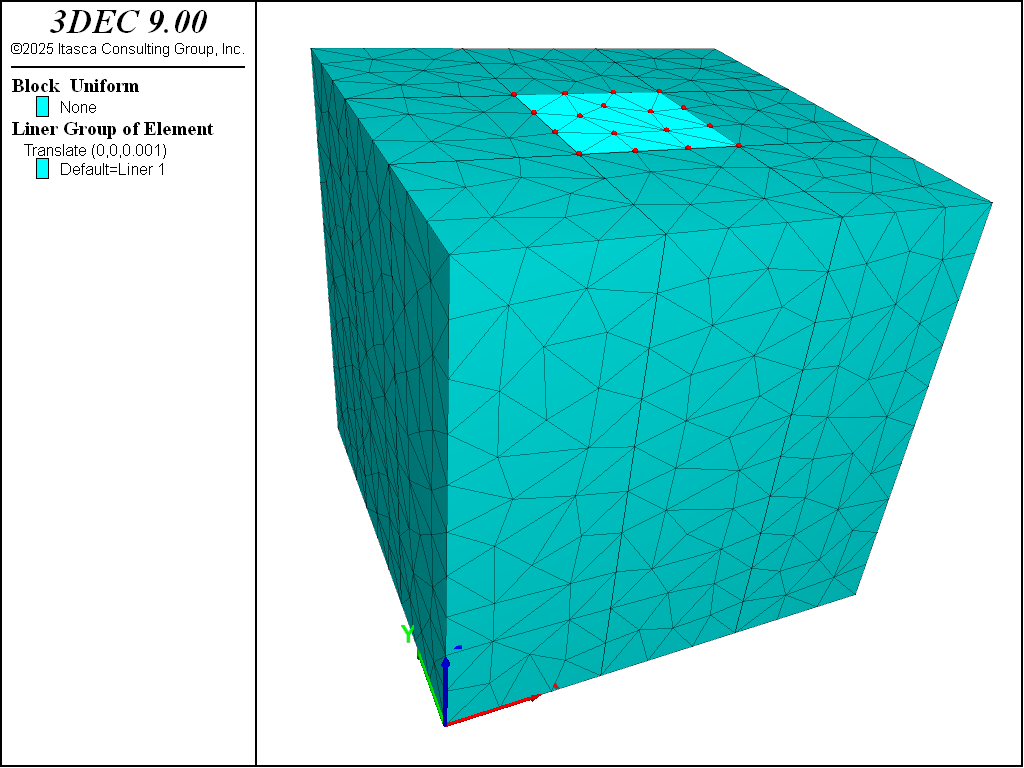
Figure 1: 3DEC model for simple test of liner-block interface behavior.
The test is performed in six stages. During each stage, a normal or shear displacement is applied, while the other displacement component is fixed. The displacements applied during each stage are listed in Table 2, where positive/negative normal displacement indicates separation/overlap, and shear motion along the diagonal in the direction (1,1,0) is positive. The testing results are shown in Figure 2 to Figure 7.
Stage |
Normal (mm) |
Shear (mm) |
|---|---|---|
1a |
0 |
+15 |
1b |
0 |
-5 |
2 |
-10 |
0 |
3 |
0 |
+10 |
4 |
+20 |
0 |
6a |
-20 |
0 |
6b |
0 |
+6 |
During stage 1, a positive shear displacement of 15 mm is followed by a negative shear displacement of 5 mm. The response is shown in Figure 2, which can be compared with shear interface behavior. The slope of this plot equals the shear coupling spring stiffness per unit area, \(k_s\), and the maximum value equals the cohesion, \(c\) (because, at this stage, the interface normal stress is zero). The unloading slope is the same as the loading slope.
During stage 2, the liner is moved downward by 10 mm. The response is shown in Figure 3, which can be compared with normal interface behavior. The slope of this plot equals the normal coupling spring stiffness per unit area, \(k_n\). At this stage, the interface normal stress, \(\sigma_n\), equals 8 MPa. During stage 3, an additional shear displacement of 10 mm is applied, and the response is shown in Figure 4. The shear stress increases and reaches a maximum value of 6.91 MPa, which corresponds with the relation
where:
\(c\) = cohesion;
\(\sigma_n\) = interface normal stress; and
\(\phi\) = friction angle.
During stage 4, the liner is moved upward by 20 mm. The response is shown in Figure 5. When the interface normal stress reaches the tensile strength, \(f_t\), of 4 MPa, the spring breaks, causing the interface normal stress to drop to zero. When the liner fails in tension, the effective cohesion becomes \(c_r\), and the tensile strength is set to zero. The total relative normal displacement continues to be tracked such that compressive normal stress will again develop when the gap closes. During stage 5, an additional shear displacement of 2 mm is applied, and the response is shown in Figure 6. The peak shear stress drops from 6.91 to 2 MPa, because the interface normal stress is zero, and the residual cohesion is now being used. During stage 6, the liner is moved downward by 20 mm, and then an additional shear displacement of 6 mm is applied. The response is shown in Figure 7. The gap has closed, and the interface normal stress is again 8 MPa. The peak shear stress is 4.91 MPa, in accord with the residual cohesion.
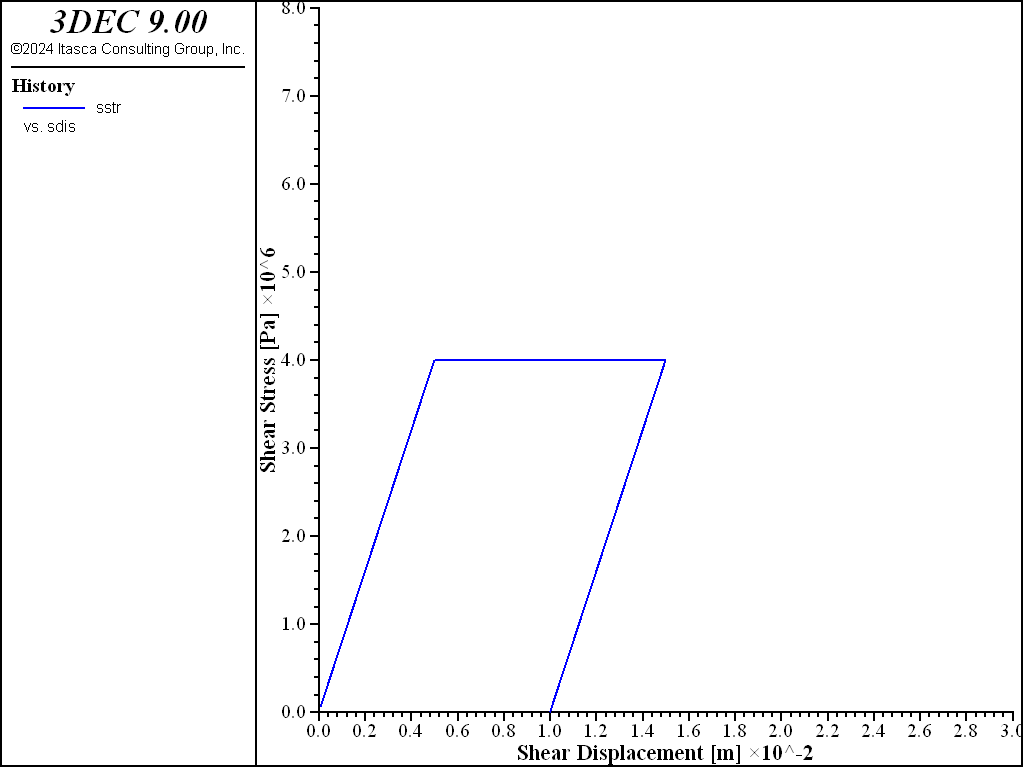
Figure 2: Shear stress versus shear displacement (after stage 1).
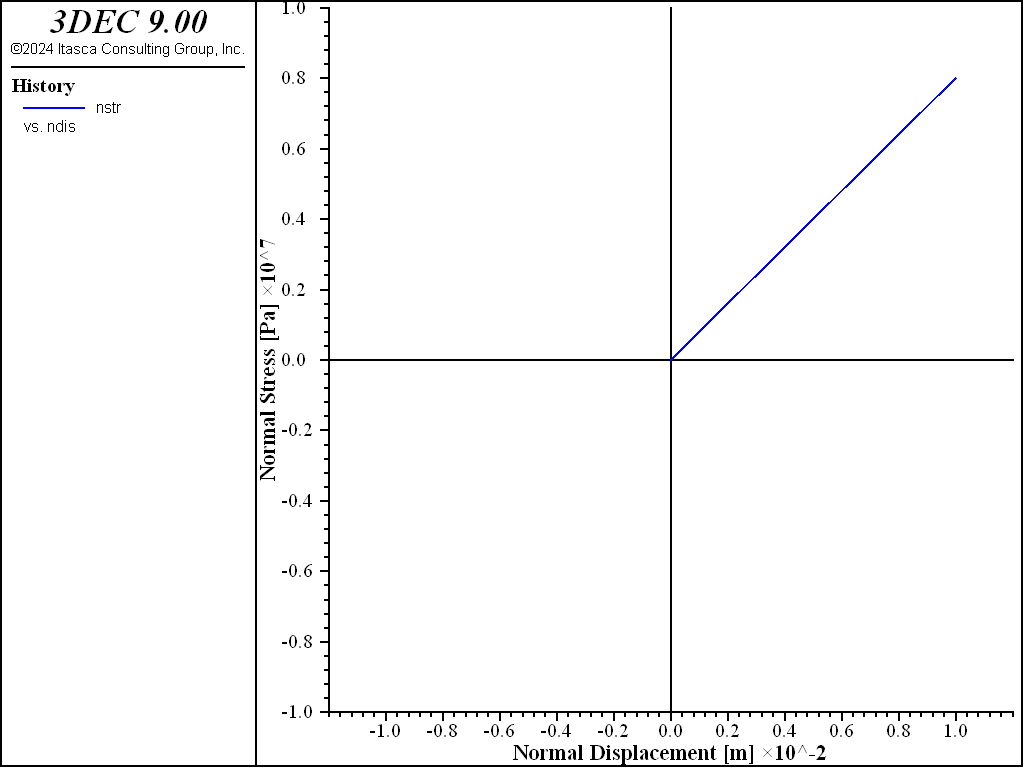
Figure 3: Normal stress versus normal displacement (after stage 2).
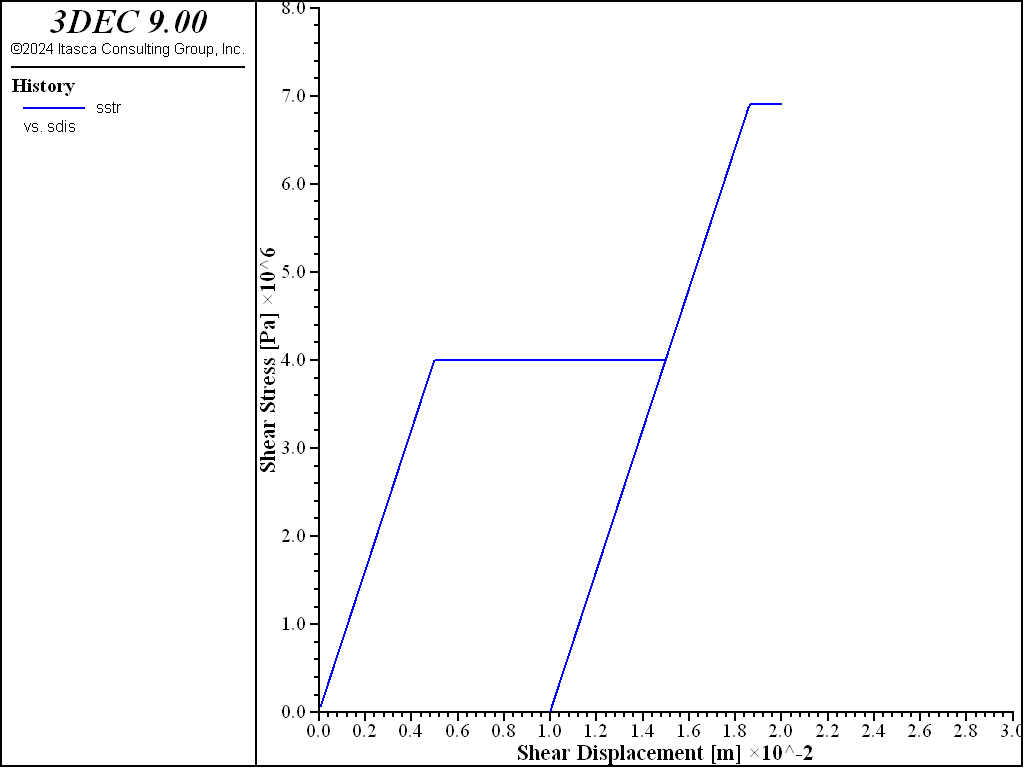
Figure 4: Shear stress versus shear displacement (after stage 3).
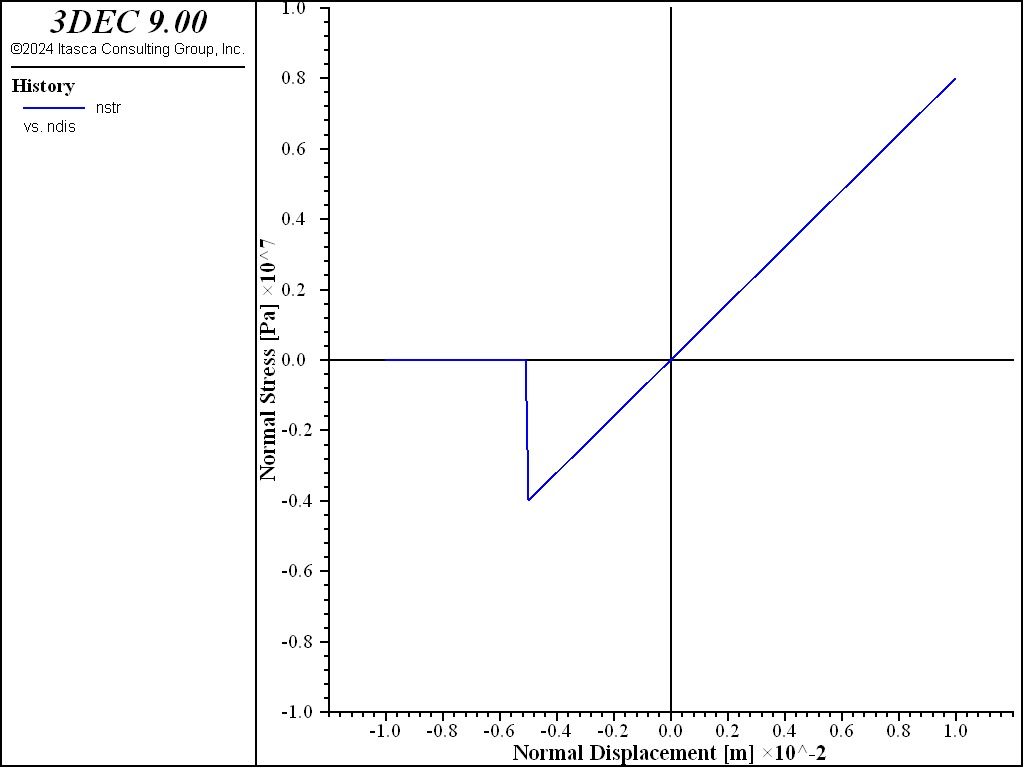
Figure 5: Normal stress versus normal displacement (after stage 4).
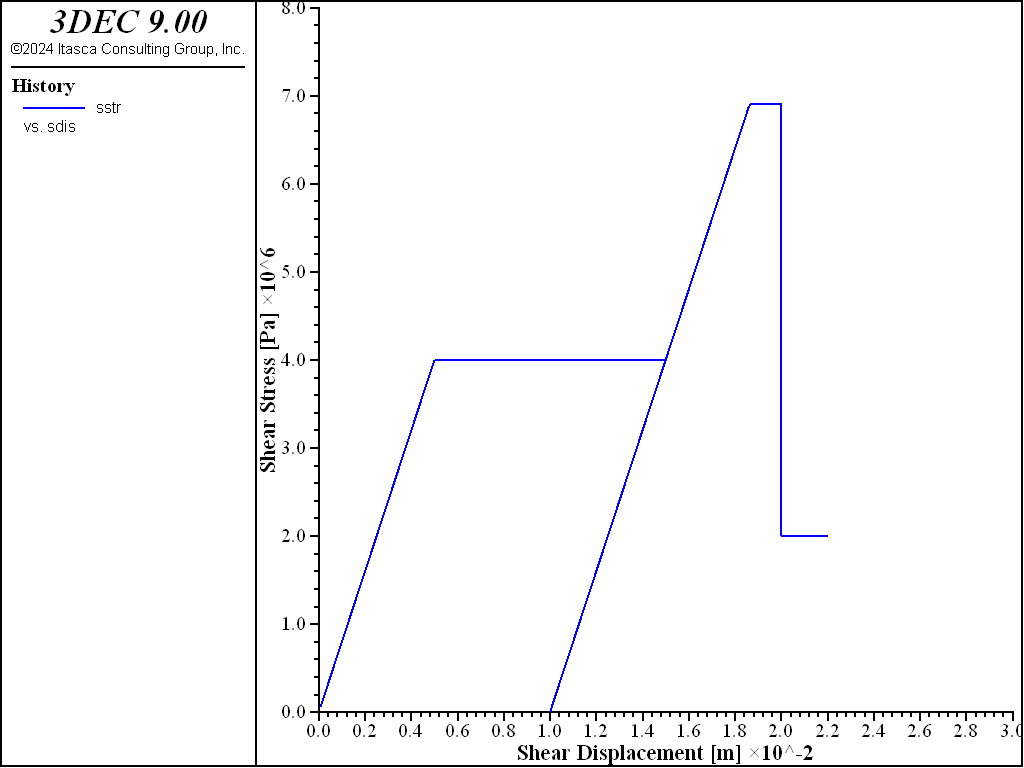
Figure 6: Shear stress versus shear displacement (after stage 5).
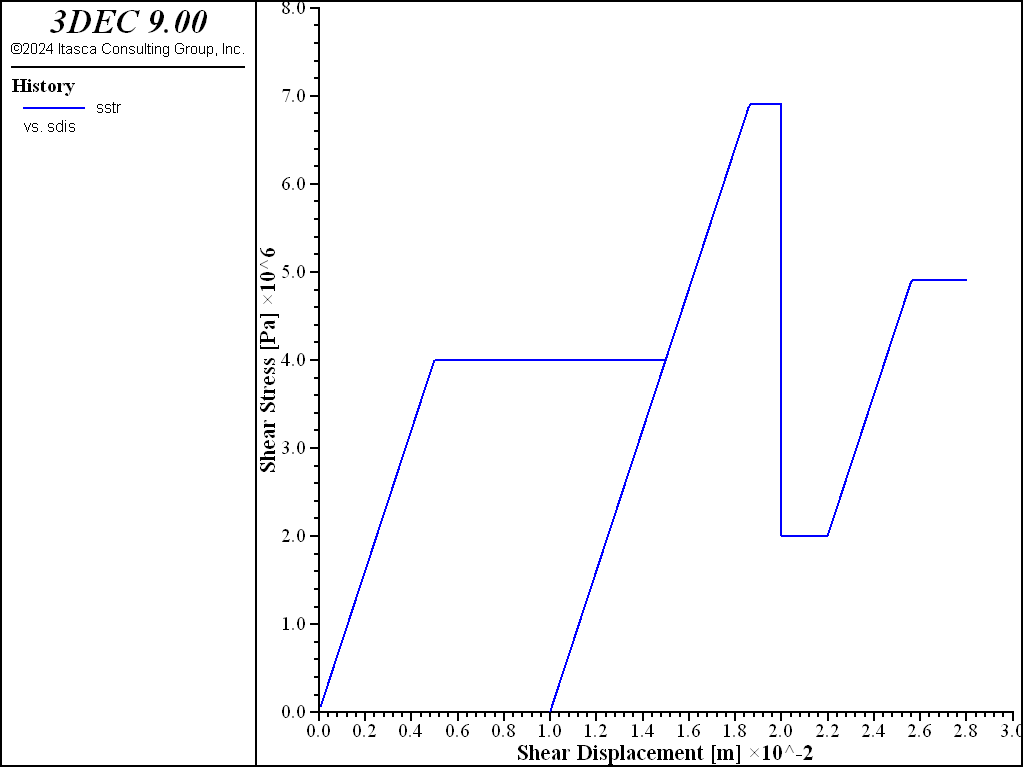
Figure 7: Shear stress versus shear displacement (after stage 6).
Data File
LinerZoneInterfaceTest.dat
; Liner example application
; Simple test of Liner-Block Interface Behavior
model new
model random 10000
model large-strain off
model title 'Simple Test of Liner-Block Interface Behavior'

; Create the soil.
block create brick 0 1

; cut brick to enable adding of square liner covering 1/3 of the surface
block cut joint-set dip 90 dip-direction 90 origin 0.33 0 0
block cut joint-set dip 90 dip-direction 90 origin 0.66 0 0
block cut joint-set dip 90 dip-direction 0 origin 0 0.33 0
block cut joint-set dip 90 dip-direction 0 origin 0 0.66 0

block join

block zone generate edgelength 0.1

block zone cmodel assign elastic
block zone property density 2000 bulk=12.5e6 shear=5.77e6  ; soil

; Create the concrete liner.
structure liner create by-block-face range position (0.33,0.33,1) (0.66,0.66,1)
structure liner cmodel assign elastic
structure liner property young 25e9 poisson 0.15 thickness=0.1  ; concrete
structure liner property coupling-stiffness-normal=8e8 ...
                      coupling-stiffness-shear=8e8  ...
                      coupling-yield-normal=4e6     ...
                      coupling-cohesion-shear=4e6   ...
                      coupling-cohesion-shear-residual=2e6 ...
                      coupling-friction-shear=20.0
;
; fully fix all zones
block gridpoint apply velocity 0 0 0 range position-x 0
block gridpoint apply velocity 0 0 0 range position-x 1
block gridpoint apply velocity 0 0 0 range position-y 0
block gridpoint apply velocity 0 0 0 range position-y 1
block gridpoint apply velocity 0 0 0 range position-z 0
block gridpoint apply velocity 0 0 0 range position-z 1

structure node fix velocity    ; fully fix all nodes
structure liner history name='nstr' ...
                     coupling-stress-normal       node 3 component-id 3
structure liner history name='ndis' ...
                     coupling-displacement-normal node 3 component-id 3
structure liner history name='sstr' ...
                     coupling-stress-shear        node 3 component-id 3
structure liner history name='sdis' ...
                     coupling-displacement-shear  node 3 component-id 3

; Apply six sets of normal/shear displacements to liner.
structure mechanical damping combined-local
model cycle 1 ; to get timestep
[dt_ = mech.timestep]
structure node initialize velocity ...
            [0.707e-5/dt_] [0.707e-5/dt_] 0 local     ; norm disp=   0 mm
model cycle 1500                                      ; shr  disp= +15 mm
structure node initialize velocity ...
            [-0.707e-5/dt_] [-0.707e-5/dt_] 0 local   ; norm disp=   0 mm
model cycle 500                                       ; shr  disp=  -5 mm
model save 'stage1'

structure node initialize velocity 0 0 [-1e-5/dt_] local ; norm disp= -10 mm
model cycle 1000                                      ; shr  disp=   0 mm
model save 'stage2'

structure node initialize velocity ...
            [0.707e-5/dt_] [0.707e-5/dt_] 0 local     ; norm disp=   0 mm
model cycle 1000                                      ; shr  disp= +10 mm
model save 'stage3'

structure node initialize velocity 0 0 [1e-5/dt_] local  ; norm disp= +20 mm
model cycle 2000                                      ; shr  disp=   0 mm
model save 'stage4'

structure node initialize velocity ...
            [0.707e-5/dt_] [0.707e-5/dt_] 0 local     ; norm disp=   0 mm
model cycle 200                                       ; shr  disp=  +2 mm
model save 'stage5'

structure node initialize velocity 0 0 [-1e-5/dt_] local ; norm disp= -20 mm
model cycle 2000                                      ; shr  disp=   0 mm
structure node initialize velocity ...
            [0.707e-5/dt_] [0.707e-5/dt_] 0 local     ; norm disp=   0 mm

model cycle 600                                       ; shr  disp=  +6 mm
model save 'stage6'
Endnote
| Was this helpful? ... | Itasca Software © 2024, Itasca | Updated: Nov 12, 2025 |
