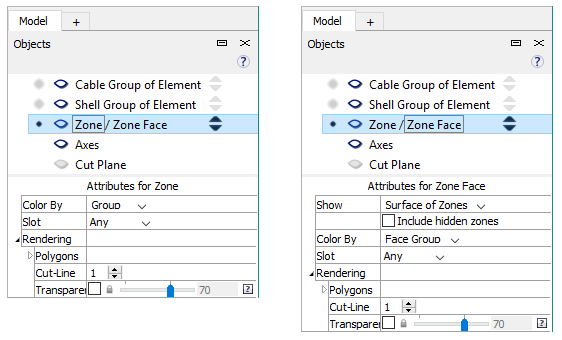
Control Set: Objects
The Objects control set holds the equivalent of plot items for whichever types of data are available for viewing. Attributes are displayed for the selected “plot item”. Each of the attributes is described with a tool tip.
When more than one type of data is available, multiple plot items appear in the list. The black dot on the left indicates which plot item is interactive for the purpose of selection. To allow selection of objects in a different plot item, click the gray spot to the left of the plot item’s name.
While zones and faces can be rendered using transparency, a mouse click can only select them when they are rendered solid.
When zones and zone faces are available, only one of the two types of object can be viewed at a time.
When there are multiple data types, one data type may get plotted on top of another, blocking the other from view. For example, zone faces and 2D structural elements may be drawn in the same location, but one of them will be drawn on top of the other. You can click the up/down arrow icons to change the order the plot items are drawn in. Items at the top of the list are drawn first and subsequent items are drawn on top of them. The black dot at the left of a plot item name overrides all that, because the currently active data type needs to be selectable.

| Was this helpful? ... | Itasca Software © 2024, Itasca | Updated: Nov 12, 2025 |
