Saturated/Unsaturated Flow, Using Simple-Fluid Mode
In order to benefit from the implicit approach for unsaturated cases, FLAC3D provides an alternative approach called simple-fluid option,
which can be activated by the command model simple-fluid on. This option allows to specify always saturated fluid zones in the model:
Apparent saturation (or saturation ratio) is calculated from the matrix suction according to specified relationships.
Reduced permeability via permeability ratio (or relative permeability) is calculated from the apparent saturation by specified relationships.
The phreatic surface is calculated at zero pore-pressure contour.
Apparent Saturation vs. Matrix Suction Relationships
The relationships between apparent saturation and matrix suction (Figure 1) is also referred as soil-water characteristic curves. These relationships, strictly, are different in the drying and wetting paths, a phenomenon referred as hysteresis. It is necessary to determine a suitable drying and wetting curve for engineering problems where the variable of interest from the modeling exercise is significantly dependent upon the unsaturated soil property functions (Fredlund et al, 2012). In a relatively coarse analysis, a single curve is used for both drying and wetting.
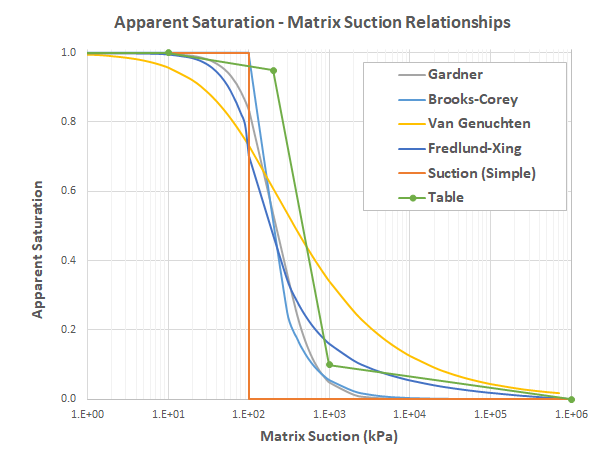
Figure 1: Implemented apparent saturation versus matrix suction relationships.
Suction Limit (Simple) Relationship
This relationship assumes that the parapet saturation \(\hat{s}\) is 1 when the the matrix suction \(\psi\) (a positive value when the pore-pressure is negative) is less than the input suction limit \(\psi^0\), while it is 0 when the matrix suction is equal to or greater than the input suction limit:
Brooks-Corey Relationship
Brooks-Corey (1964) relationship assumes that the parapet saturation \(\hat{s}\) is 1 when the the matrix suction \(\psi\) is less than the air-entry suction \(\psi_{ae}\), while it is a power function when the matrix suction is equal to or greater than the air-entry suction:
where \(\psi_{ae}\) is the air-entry suction in unit of stress, and \(n\) is a dimensionless material parameter called pore size index.
Gardner Relationship
Gardner (1958) relationship is :
where \(\psi_r\) is a reference suction in unit of stress, \(a\) and \(n\) are dimensionless material parameters.
Van Genuchten Relationship
Van Genuchten (1980) relationship is :
where \(\psi_r\) is a reference suction in unit of stress, \(m\) and \(n\) are dimensionless material parameters.
Fredlund-Xing Relationship
Fredlund-Xing (1994) relationship is :
where \(C\) is bounded in the range of [0,1]; \(\psi_r\) is a reference suction, \(\psi_s\) is the residual suction, and \(\psi_u\) is the ultimate suction (typical value is 1e6 kPa.), all in unit of stress; \(m\) and \(n\) are dimensionless material parameters; and \(e\) is the base of the natural logarithm.
Table Relationship
This allows to input any user-defined piecewise relationship between apparent saturation and matrix suction by assigning a table (see Figure 1). The table is valued by pairs of (\(\psi\), \(\hat{s}\)). Note that apparent saturation is calculated by the linear interpolation method from the table based on the logarithmic scale (base 10) of matrix suction.
Permeability Ratio vs. Apparent Saturation Relationships
The relationships between permeability ratio and apparent saturation (Figure 2) is also referred as soil-water characteristic curves (SWCCs). These relationships, strictly, are different in the drying and wetting paths, a phenomenon referred as hysteresis. It is necessary to determine a suitable drying and wetting curve for engineering problems where the variable of interest from the modeling exercise is significantly dependent upon the unsaturated soil property functions (Fredlund et al, 2012). In a relatively coarse analysis, a single curve is used for both drying and wetting.
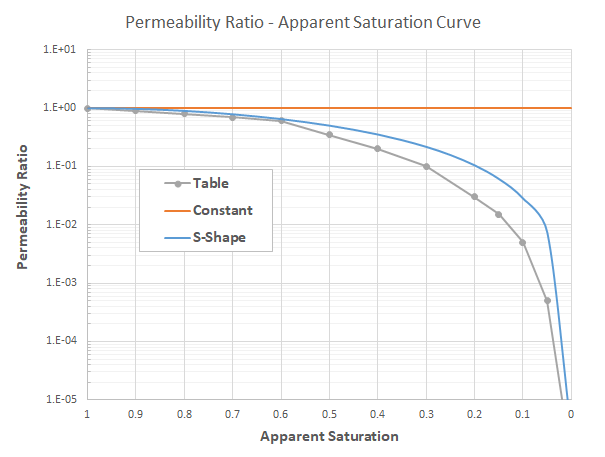
Figure 2: Implemented permeability ratio versus apparent saturation relationships.
S-Shape Relationship
The relationship between the permeability ratio and the apparent saturation is
It is a S-shaped function in normal numerical scales of permeability ratio and the apparent saturation. Note that it does not appear a S-shape if permeability ratio is in logarithmic scale (see Figure 2).
Constant Relationship
The permeability ratio is a constant of 1.0, regardless of the apparent saturation. This should be used in caution because the specific discharge does not reduce with apparent saturation.
Table Relationship
This allows to input any user-defined piecewise relationship between permeability ratio and apparent saturation by assigning a table (see Figure 2). The table is valued by pairs of (\(\hat{s}\), \(\hat{k}\)). Note that permeability ratio is calculated by the linear interpolation method from the table based on the logarithmic scale (base 10) of permeability ratio.
| Was this helpful? ... | Itasca Software © 2024, Itasca | Updated: Nov 12, 2025 |
