Burgers-Mohr/Power-Mohr Model: Loading/Unloading Compression Test
Note
To view this project in FLAC3D, use the menu command . The project’s main data files are shown at the end of this example.
This example shows the influence of loading rate on the axial stress response of two viscoplastic samples in an unconfined compression test. The viscoelastic behavior of the first sample obeys a generalized Kelvin law; that of the second obeys a power law. Yielding is characterized by a Mohr-Coulomb failure criterion in both cases. The viscoplastic behavior is compared to that of a third sample, made of elasto-plastic Mohr-Coulomb material, and undergoing the same velocity-controlled compression test. All values quoted in this section may be interpreted in any consistent system of units, but are probably not representative, and are given only for purposes of illustration.
The viscoplastic and viscoelastic samples are represented by one zone each, using the Burgers-Mohr model, the Power-Mohr model, and the Mohr-Coulomb model. To represent the generalized Kelvin viscous behavior, the viscous component of the Maxwell cell in viscosity-maxwell is not activated. In the first part of the test, a vertical compressive velocity of magnitude 10-4 (in units of distance per unit time) is applied on both sides of the samples for a total of 1500 steps. The timestep is set to 10-3, a value small compared to the ratio \(\eta ^K/G^K\) of 10.
For the unconfined compression test considered here, the Mohr-Coulomb failure criterion predicts that shear yielding will take place when the axial stress reaches the value of \(-2C\sqrt{N_\phi}\) (\(\simeq -1.28\) × 106). On the other hand, the axial stress in the elasto-plastic sample is given, up to incipient failure, by the elastic relation
where \(\alpha_1 = K + 4/3 G\), \(\alpha_2 = K - 2/3 G\), \(\epsilon_{xx}=-2vt/L\), \(v\) is the applied velocity magnitude, \(t\) is the simulation time elapsed to incipient failure, and \(L\) is the horizontal length of the sample. With the parameter values adopted in the simulation, failure will thus occur in the Mohr-Coulomb sample around \(t\) = 0.762 (i.e., after 762 simulation steps).
The numerical results are presented in Figure 1. Note that the Burgers-Mohr and Power-Mohr samples fail at the same stress level, but later in time, thus reflecting the effect of creep (at incipient failure, for the model parameter used in the simulation, the time is about 1.00 for the Burgers-Mohr sample and about 0.85 for the Power-Mohr sample). When the loading rate is increased, and the simulation is repeated for the same final amount of deformation (the applied velocity is increased, the same number of steps is used but the timestep is reduced), the responses of the two models become more similar. For a velocity of 10-2, the effect of creep cannot be detected on the plot—see Figure 2 (at incipient failure, the creep time is now about 0.762 × 10⁻²).
In the second part of the test, the compressive velocity is set to zero and the models are cycled for 500 steps. While the Mohr-Coulomb sample stays at yield, the Burgers-Mohr and Power-Mohr samples unload as creep develops (see Figure 3). The interaction between creep and plastic flow in the Burgers-Mohr sample may be appreciated by comparing the viscoplastic behavior in Figure 3 and Figure 4; in the latest plot, more plastic flow (measured by strain-shear-plastic) is allowed to take place before the compressive velocity is set to zero and, subsequently, the magnitude of maximum creep unloading is reduced.
In the third part of the test, the samples are “reloaded” by application of a FLAC3D velocity of 5 × 10⁻⁵, for a total of 2000 steps. At this stage, all three samples are yielding at the same stress level (see Figure 5). To complete the test, the compressive velocity is set to zero again and the models are cycled for another 1500 steps. The evolution of axial stress during this final stage may be observed in Figure 5.
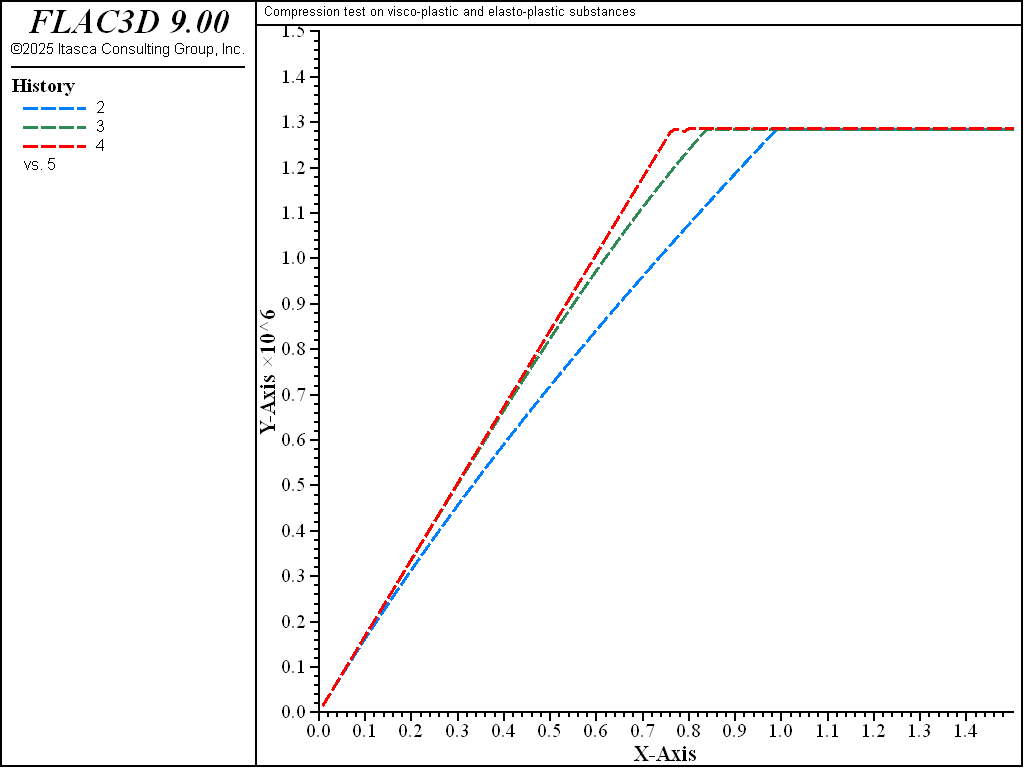
Figure 1: Axial stress versus time for slow compression test—Burgers-Mohr, Power-Mohr, and Mohr-Coulomb models.
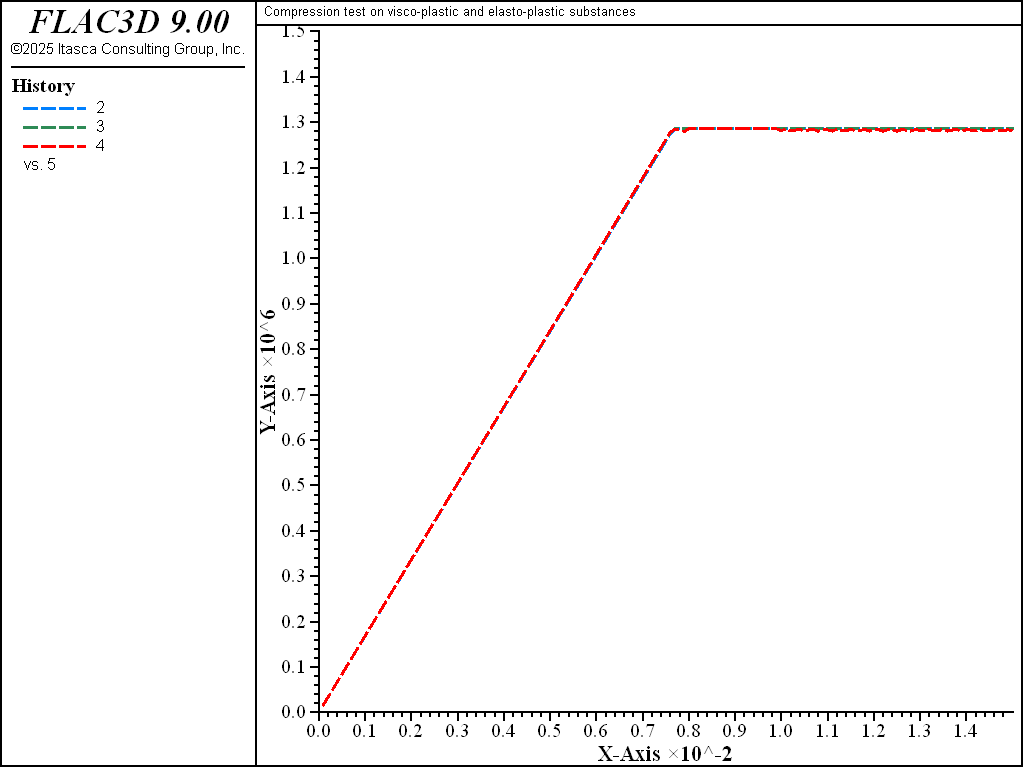
Figure 2: Axial stress versus time for rapid compression test—Burgers-Mohr, Power-Mohr, and Mohr-Coulomb models.
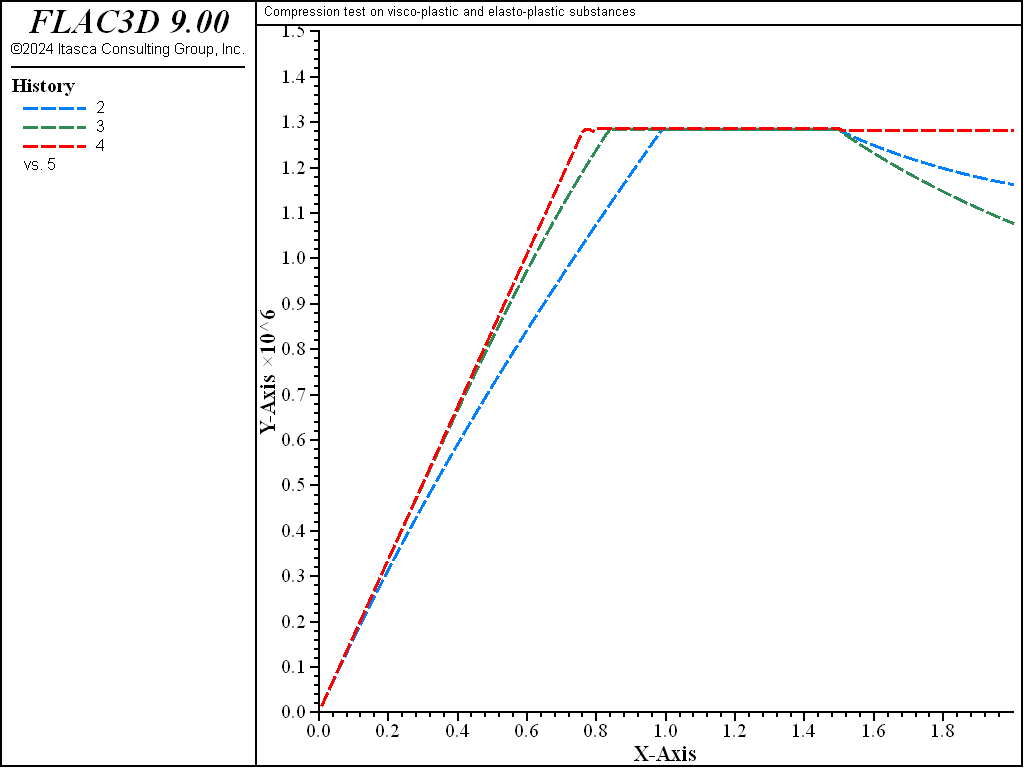
Figure 3: Creep unloading after less plastic flow—Burgers-Mohr, Power-Mohr, and Mohr-Coulomb models.
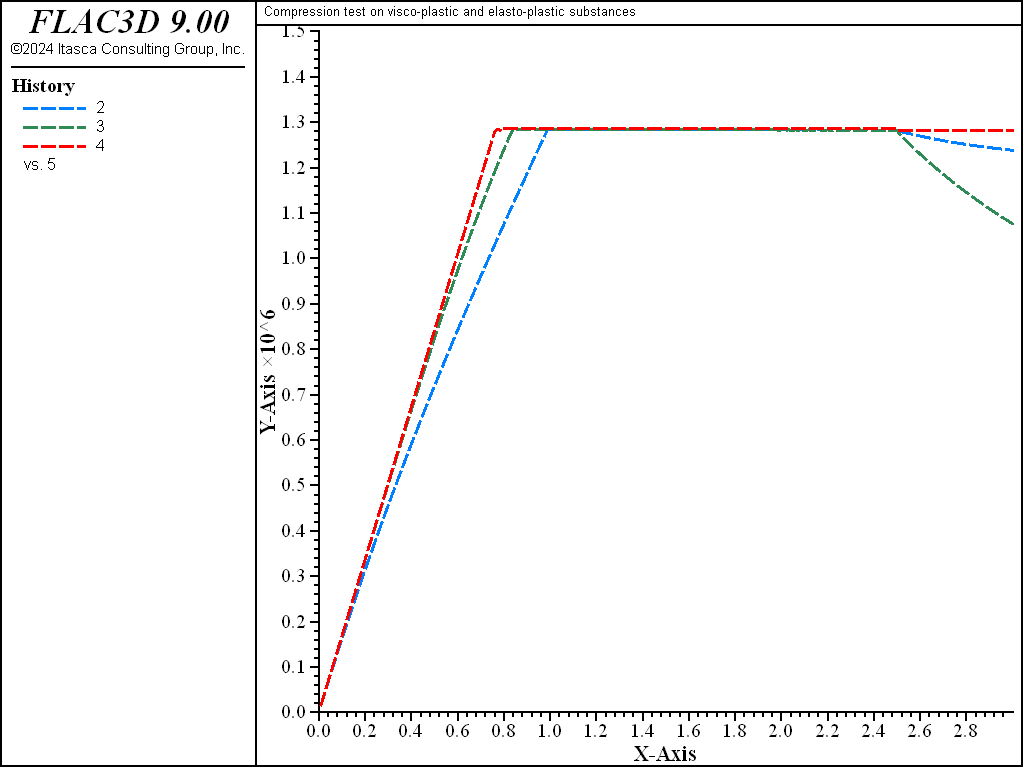
Figure 4: Creep unloading after more plastic flow—Burgers-Mohr, Power-Mohr, and Mohr-Coulomb models.
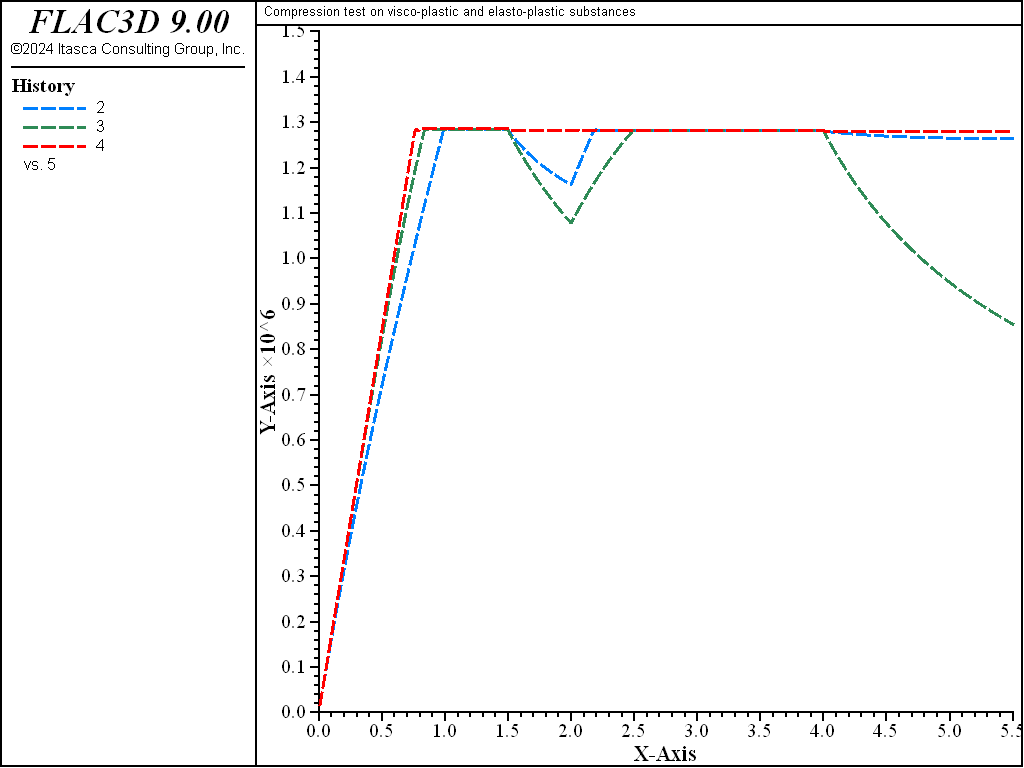
Figure 5: Axial stress versus time for several loading excursions—Burgers-Mohr, Power-Mohr, and Mohr-Coulomb models.
Data File
;------------------------------------------------------------------
;       Compression test -- visco-plastic and elasto-plastic substances
;-------------------------------------------------------------------
model new
model large-strain off
fish automatic-create off
model title "Compression test on visco-plastic and elasto-plastic substances"
model configure creep

program call 'parameter'
[calc(3.0,1.e-4,1.e-3)]
fish list [szmax] [tim] [ns]
zone create brick size 5 1 1 point 0 0 0 0  point 1 15 0 0  ...
                             point 2 0 3 0  point 3 0 0 3
zone cmodel assign burgers-mohr range position-x 0 3
zone property bulk [bu] range position-x 0 3
zone property shear-maxwell [sh] range position-x 0 3
zone property shear-kelvin [sh] viscosity-kelvin [visc] range position-x 0 3
zone property cohesion [co] friction [fr] tension [ten] range position-x 0 3
;
zone cmodel assign null range position-x 3 6
;
zone cmodel assign power-mohr range position-x 6 9
zone property density 2500 bulk [bu]  range position-x 6 9
zone property shear [sh] range position-x 6 9
zone property constant-1=1e-23 exponent-1=3 range position-x 6 9
zone property cohesion [co] friction [fr] tension [ten] range position-x 6 9
;
zone cmodel assign null  range position-x 9,12
;
zone cmodel assign mohr-coulomb range position-x 12 15
zone property density 2500 bulk [bu] shear [sh] range position-x 12 15
zone property cohesion [co] friction [fr] tension [ten] range position-x 12 15
[squez(1e-4)]
zone gridpoint fix velocity-z
zone history displacement-z position 0 0 0
zone history stress-zz position  1.5 1.5 1.5
zone history stress-zz position  7.5 1.5 1.5
zone history stress-zz position 13.5 1.5 1.5
model history creep time-total
model save 'm'
;     a) experiment 1: slow compression test
model restore 'm'
model creep timestep fix 1e-3
model step 1500
model save 'ex1'
;     b) experiment 2: rapid compression test
model restore 'm'
model creep timestep fix 1.e-5
[squez(1.e-2)]
model step 1500
model save 'ex2'
;     c) experiment 3: creep unloading after less plastic flow
model restore 'm'
model creep timestep fix 1.e-3
model step 1500
[squez(0.0)]
model step 500
model save 'ex3'
;     d) experiment 4: creep unloading after more plastic flow
model restore 'm'
model creep timestep fix 1.e-3
model step 2500
[squez(0.0)]
model step 500
model save 'ex4'
;     e) experiment 5: loading/unloading excursions
model restore 'm'
model creep timestep fix 1.e-3
model step 1500
[squez(0.0)]
model step 500
[squez(5.0e-5)]
model step 2000
[squez(0.0)]
model step 1500
model save 'ex5'
⇐ Maxwell/Burgers Model: Compression Test | WIPP-Drucker Model: Comparison with Drucker-Prager Model ⇒
| Was this helpful? ... | Itasca Software © 2024, Itasca | Updated: Nov 12, 2025 |
