Examples • Example Applications
Analysis of a Concrete Diaphragm Wall (FLAC2D)
Problem Statement
Note
This project reproduces Example 10 from FLAC 8.1. The project file for this example is available to be viewed/run in FLAC2D.[1] The project’s main data files are shown at the end of this example.
A concrete diaphragm wall is a continuous concrete wall built into the ground from the ground surface. The wall may consist of precast or cast-in-place concrete panels, or contiguous bored concrete piles. The most common type of wall is a tremie-concrete diaphragm wall cast within a slurry stabilized trench. Trenches are 0.6 to 1.0 meter wide and are excavated in 3 to 6 meter lengths. After the individual panels are excavated, end stops and reinforcing are installed. Concrete is placed and the end stops are removed. Once the concrete has set, the neighboring panel can be excavated. After all panels have been constructed, the major excavation can begin, with internal bracing installed as the excavation progresses. In saturated ground, dewatering must also be performed.
The various stages of construction of a diaphragm wall can be simulated with FLAC2D. This example models the stages following the construction of the panels. Dewatering, excavation, and installation of struts are simulated in five excavation stages.
A cross-section through the diaphragm wall, given in Figure 1, shows the subsurface conditions, the depth at each of the five excavation stages, and the location of the support struts. The mechanical properties of the soil layers are summarized in Table 1. A cohesion of 0 is assumed for all soil layers.
A porosity of 0.3 and a hydraulic-conductivity of 1e-6 m/s for all layers are assumed. The permeability (hydraulic conductivity) and fluid modulus are not important in this example, which is only solved to steady state for the fluid.
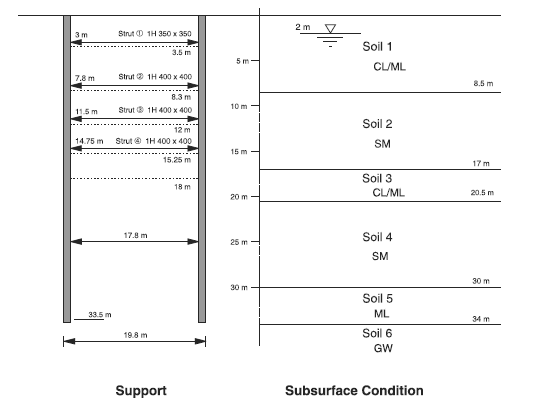
Figure 1: Cross-section through diaphragm wall
Layer |
Dry Density (\(kg/m^3\)) |
Young’s Modulus (MPa) |
Poisson’s Ratio |
Friction Angle (degrees) |
|---|---|---|---|---|
Soil 1 |
1880 |
25.4 |
0.25 |
30 |
Soil 2 |
1980 |
60.0 |
0.17 |
32 |
Soil 3 |
1910 |
50.5 |
0.25 |
30 |
Soil 4 |
1970 |
77.4 |
0.19 |
34 |
Soil 5 |
1980 |
117.9 |
0.25 |
32 |
Soil 6 |
1700 |
130.2 |
0.22 |
38 |
A thick aquifer of dense gravel is located below a depth of 34 meters. The pore pressure is assumed to be a constant value of 317 kPa at the bottom of the diaphragm wall. The wall is 1 meter thick and is assumed to behave as an elastic material with a Young’s modulus of 19.2 GPa and Poisson’s ratio of 0.2. The struts are spaced at 2-meter intervals and are preloaded. The excavation and dewatering depths are listed in Table 2. The locations and properties of the struts are summarized in Table 3. The Young’s modulus for the struts is 200 GPa.
Of interest in this analysis are the distribution of shear force and bending moment in the wall, the axial force in the struts, and the displacements of the soil behind the wall.
Excavation Depth (m) |
Dewatering Depth (m) |
|---|---|
4.0 |
5.0 |
8.0 |
9.0 |
12.0 |
13.0 |
15.0 |
16.0 |
18.0 |
19.0 |
Strut Number |
Depth (m) |
Area (m²) |
Moment of Inertia (m⁴) |
Preload (kN) |
|---|---|---|---|---|
1 |
3 |
173.9 × 10 -4 |
4.03 × 10 -4 |
200 |
2 |
7 |
218.7 × 10 -4 |
6.60 × 10 -4 |
400 |
3 |
11 |
218.7 × 10 -4 |
6.60 × 10 -4 |
450 |
4 |
14 |
218.7 × 10 -4 |
6.60 × 10 -4 |
400 |
Modeling Procedure
The numerical analysis for this problem provides a solution at each of the five excavation depths. At each depth, the modeling sequence includes dewatering, excavation, and strut installation steps. A vertical line of symmetry is taken through the center of the excavation, and only one wall is modeled.
Model Geometry
The grid for this analysis can be created in the Sketch workspace by following these steps:
Create a new sketch.
Import the “DIAP.DXF” file. This can be found where the examples are installed. The right boundary of the grid is the line of symmetry for the excavation. The left boundary is located approximately 15 times the excavation width away from the excavation in order to minimize boundary effects.
Press the button to .
To ensure a structured mesh, draw a vertical line from 0,-34 to the bottom of the model at 0,-60.
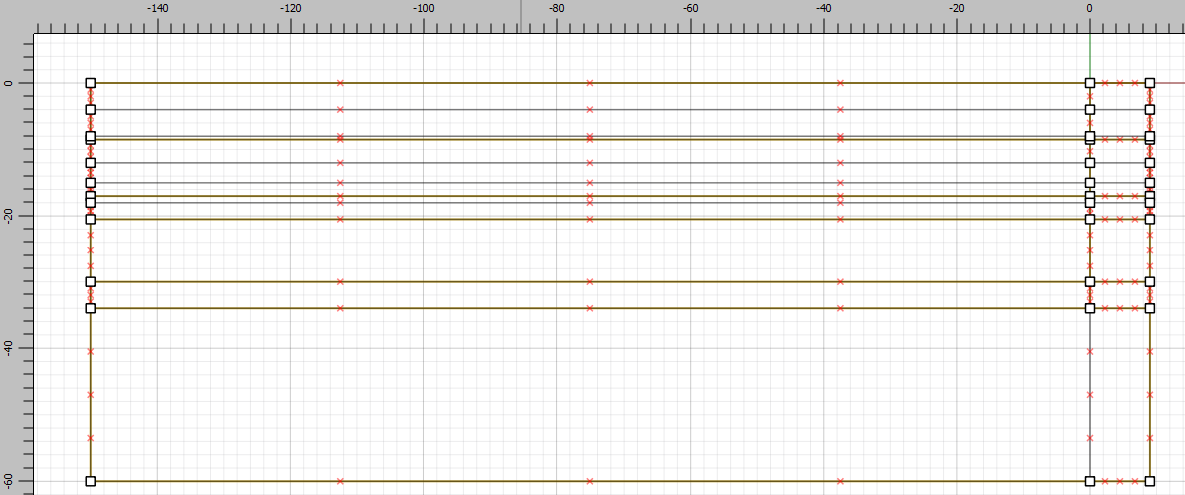
The soil layers are now defined, but the excavation stages are not. Only the right side of the model will be excavated, but to obtain a structured mesh lines should be drawn all the way across the model. So draw the following horizontal lines:
-150,-4 to 9,-4
-150,-8 to 9,-8
-150,-12 to 9,-12
-150,-15 to 9,-15
-150,-18 to 9,-18
The sketch should appear as shown below.
From the Mesh Tools, select and set the zone size to 0.5. Now select . (Note: the model uses a zone size of 0.5 to ensure that there is a layer of nodes at each water table location.)
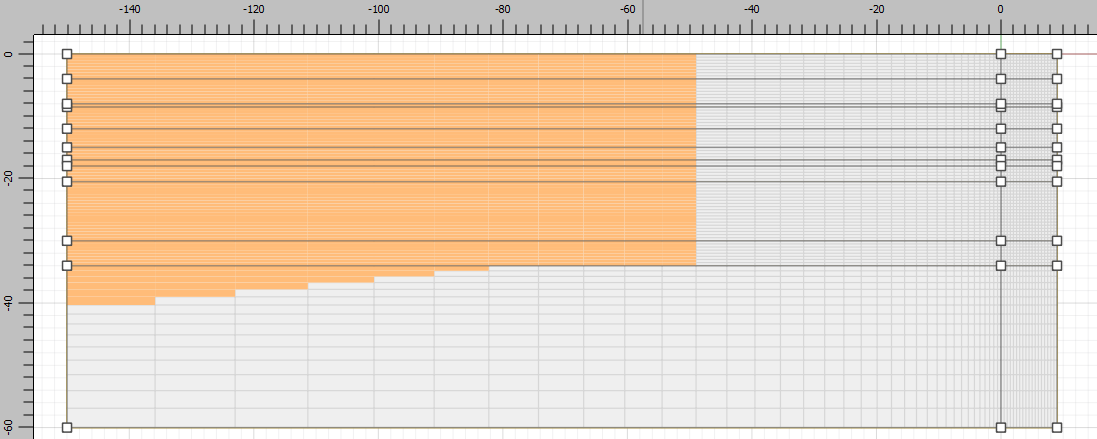
To make larger zones further from the region of interest, select the top horizontal boundary to the left of the excavation and set the number of zones to 35 and the ratio to 1.1.
Now select the vertical boundary at the bottom-right of the model, change the number of zones to 15 and the ratio to 1.1. The mesh should appear as shown below. The orange zones indicate bad aspect ratios, but because these are far from the region of interest, they are not of concern.
Select each soil layer and assign its group name, with “Soil 1” at the top and “Soil 6” at the bottom. Note that “Soil 1” consists of six blocks (between y=0 and y=-8.5), “Soil 2” also consists of six blocks (between -8.5 and -17). “Soil 3 is four blocks (-17 to -20.5) and the other three layers only consist of two blocks (to the left and right of the wall).
Select the 10 edges that form the wall (from 0,0 to 0,-34). Set the group name to “Wall”.
Create the zones. Save the project and the state. It is also a good idea to use the State Record tab in the Commands area to export the commands for the preceding operations as a data file.
Properties
In the Model workspace, zones are plotted according to group. Under for the Slot, choose Construction. The display now shows the group names that were assigned in Sketch.
Select all of the zones (Ctrl-A) and set the constitutive model to Mohr-Coulomb.
All of the material properties have been pre-entered into a database. In the Model workspace, select the top layer, choose . Click and import the database called diaphragm-wall-example.
Now expand the mohr-coulomb list on the left and note a sub-list called “wall soil”. Click on the “wall soil” header and click . Close the dialog.
Now with the top layer still selected, choose , choose “Soil 1” from the “wall soil” list and click . Now click .
Repeat for the other 5 layers. Alternatively, skip the database and enter the properties by hand for each as shown in Table 1.
Excavations
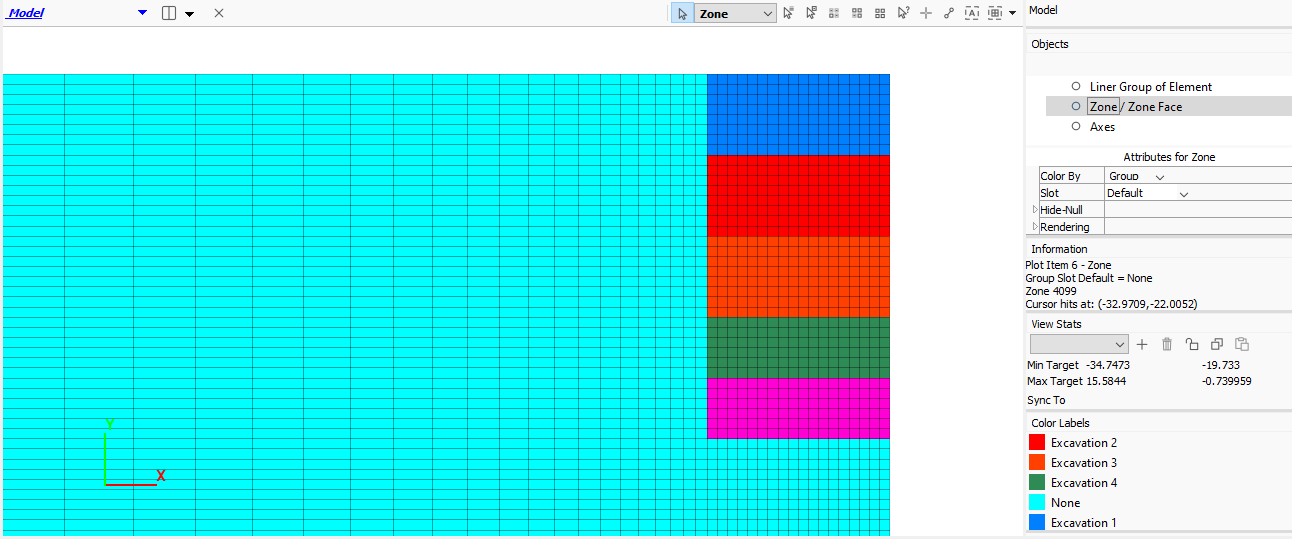
Now the group names for the excavation are set. This is done in the Model workspace rather than in the Sketch workspace so that groups may be assigned to a different slot, thus ensuring the the soil names do not get overwritten. Change the Slot for plotting the zone groups to Block. Click the top-right block and choose from the drop-down menu at the top-right. Set the group name to ‘Excavation 1’. Select the next block down and set its group name to “Excavation 2”. Now select the next two blocks and set the group to “Excavation 3”. “Excavation 4” is one block and “Excavation 5” consists of two blocks. Change the slot for plotting to and the plot should appear as shown below.
Diaphragm Wall
It is also possible to use the Model workspace to create the diaphragm wall. In the Model workspace, change the plot to show Zone Faces. Under , change the entry to . In view should be a single vertical line corresponding to the edges that were grouped in the Sketch workspace.
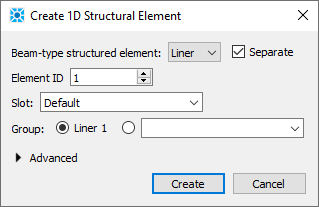
Select the line and choose from the drop down menu at the top right. For Beam-type select . Check the box for . This will create an embedded liner that has interfaces between the liner and the soil on both sides. Leave all other values as default and press .
Save the project and the state. Again, it is advisable use the State Record tab to save commands to a data file.
Initial Equilibrium
The data file used to set up boundary conditions, initial conditions, fluid and liner properties, and step to equilibrium is shown in initial.dat.
First, properties are assigned to the diaphragm wall and the interfaces. The soil/wall interface properties selected for this example are for demonstration purposes: actual values for wall friction and adhesion should be determined from physical testing or from the literature (e.g., see Clayton et al. 1993). The interface nodes are assigned low shear strength (approximately 2/3 of the soil friction angle) to simulate a relatively smooth concrete-to-soil interface. (The influence of the interface resistance can be easily investigated by varying the properties of the interface nodes.) Interface stiffness values are selected to approximate the results for the case that the wall is rigidly attached to the grid.
With structural elements in FLAC2D, the local coordinate system is such that the local \(x\)-direction is along the axis of the element, and the local \(y\)-direction is perpendicular to this. By default, the \(y\)-direction points away from the zone face to which the liner is attached. However, with embedded liners, the perpendicular direction could be either horizontal pointing to the right, or horizontal pointing to the left. To ensure a consistent coordinate system for all of the elements, the following two commands must be added.
structure node system-local x (0,1) y (1,0)
structure node fix system-local
Roller-boundary conditions are applied to the bottom and side boundaries. The ground surface is free (i.e., no applied stress). An initial stress state given by a coefficient of earth pressure at rest of 0.5 is assumed. The water table is located 2 meters below the ground surface. Groundwater flow is inhibited (fluid active off) and the water bulk modulus is set to zero so that the specified pore pressures are maintained.
Although stresses and pore pressures are initialized in the grid, some stepping is required to bring the model to equilibrium. This is because the additional weight of the beam elements representing the concrete wall produces an imbalance that necessitates some stepping to equilibrate the model again. Note that the grid is pulled down slightly as the wall settles due to gravity. See Figure 5. This problem is run in large-strain mode.
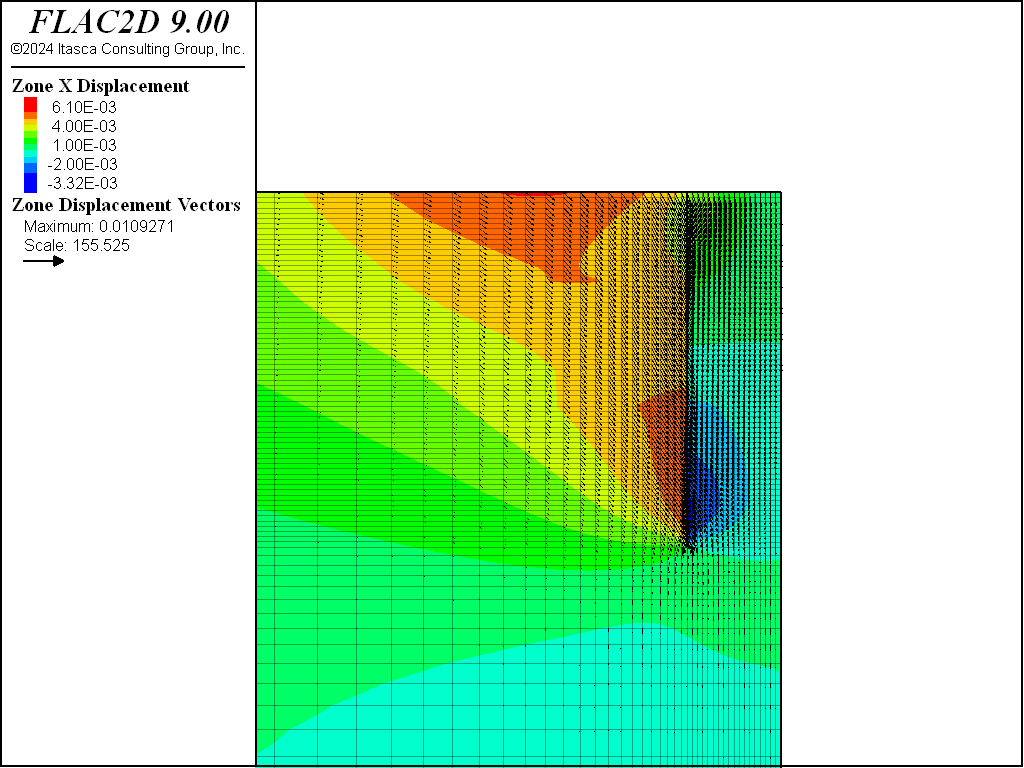
Figure 5: Displacements after solving to initial stress state.
Excavation
The structural forces in the wall arising from the presence of groundwater will depend on the details of the connection, the fluid boundary conditions, and when the support is installed. It is important to recognize the conditions that the model is to represent before setting up model conditions. For this example, the following conditions are assumed.
The structure exists independent of the grid. Forces are transmitted through the interfaces (contacts).
The wall provides an impermeable barrier to the groundwater, which acts directly on the surface of the wall.
The wall is dewatered instantaneously; no movements or transient flow effects are considered.
The pore pressure distribution in the model is changed at each stage to represent dewatering. This is done by moving the water table only for the zones in the excavated region above the aquifer. This is made easier by grouping all of the zones to the right of the wall for easy reference later. Note that if a spatial range is used when applying a water table change (e.g., range position-x 0 9), this will pick up the gridpoints to the left of the wall that have an \(x\)-coordinate of 0. To prevent that from happening, the commands use range group 'dewater' where the group name refers to zone groups. Then only gridpoints belonging to these zones will be selected. In this example the water table is moved by setting the pore pressures at the water table elevation to 0 and cycling fluid calculations only to obtain the desired pore pressure distribution at steady state. Note that the model cannot just use the command zone water plane, because the pore pressure varies from 0 at the water table to 317 kPa at the top of the aquifer, and the gradient is not equal to (fluid density)×(gravity). After reaching the steady state for the fluid, a mechanical-only calculation is performed with a fluid modulus of 0 to prevent pore pressures from changing due to mechanical deformations. The effect of dewatering for the first excavation stage is illustrated in Figure 6. This plot shows the settlement within the trench region—as well as the moments in the wall—induced by the dewatering.
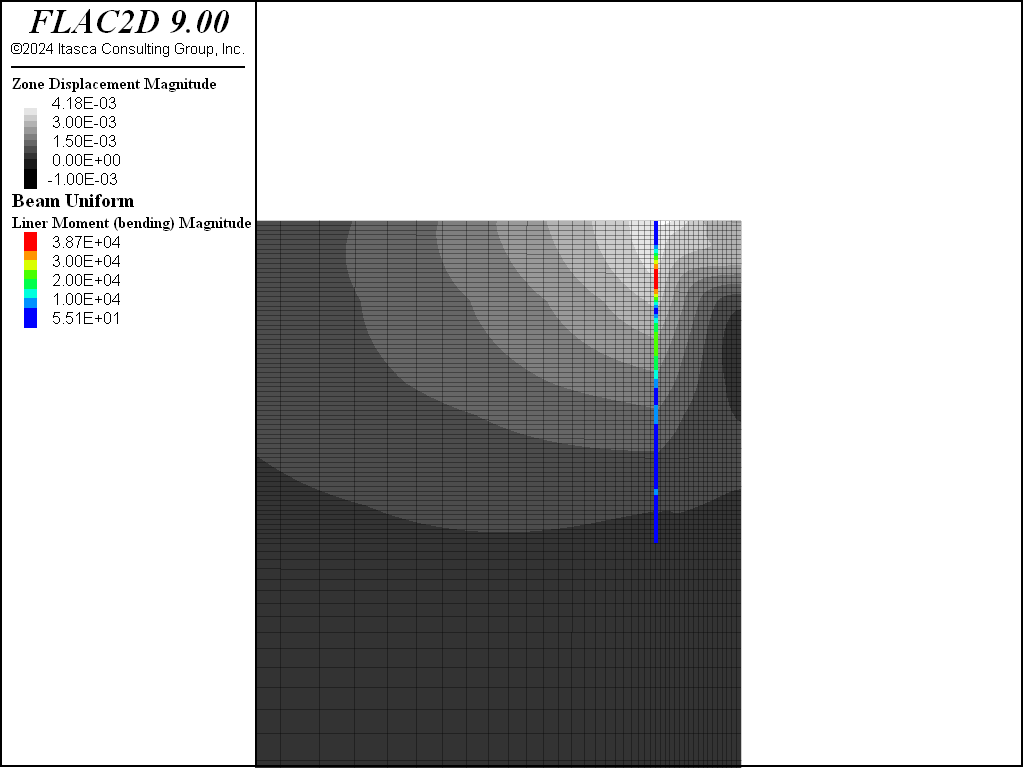
Figure 6: Displacement in the grid and moment distribution in the diaphragm wall induced by first dewatering step.
Struts
The struts are modeled with beam elements. One long element segment represents each strut. The Young’s modulus of the strut is automatically scaled by the 2-meter strut spacing when the spacing property is given. The preload applied with the structure node apply command is scaled manually by dividing the actual preload value by the 2-meter spacing.
The struts should be installed so that moments cannot develop at their connection with the wall. This is accomplished by slaving the strut node to the wall node using the structure node join command. By default, the strut node is slaved to the wall node in the \(x\)- and \(y\)-directions, and in rotation. To free the rotation, use structure link attach rotation free command. In this way, the wall and strut can move without moments developing between the strut and the wall.
A preload is applied in the \(x\)-direction to the strut node located at the centerline of the excavation (symmetry plane). This node is also prevented from rotating or translating in the \(y\)-direction. Although the fixity condition in the \(y\)-direction is not required for this problem, it may become necessary to minimize any effect of drift for excavations requiring longer struts. The fixity condition does not affect the solution, provided moments in the struts can be neglected. (Check moments in the struts to ensure that this is the case.) The preload is applied in two steps. First, the force is applied to the strut node with the structure node apply command, and the model is stepped to an equilibrium state. After the equilibrium state is achieved with the preload, the preload force is removed, the \(x\)-velocity of the node is set to zero and the strut node is fixed so that the load in the strut can change during subsequent excavation stages.
This problem is run for two cases: (1) preloading in the struts; and (2) no preloading. This allows assessing the effect of preloading on the displacement of the soil and wall, and on the loads in the wall and struts.
Results
The deflections of the diaphragm wall at each excavation stage are indicated by the plot of \(x\)-displacement of the wall structure versus wall depth in Figure 7 for the preloaded struts and Figure 8 for no preloading. These plots are table plots generated using the FISH function wall_disp. The \(x\)-displacement and the \(y\)-position of each node along the wall are stored in five tables corresponding to each excavation stage. Note that the table is stored with the \(x\) entry as the \(y\)-coordinate so that the entries will be sorted according to \(y\)-coordinate, but the table is plotted with the axes reversed to show the deflection on the \(x\)-axis. The maximum deformation is approximately 35 mm at 20 m depth for preloaded struts and 39 mm for no preload at the final stage.
Note
The results are slightly different from FLAC 8.1 because in the FLAC 8.1 model, some of the material layers are mislocated.
The actual axial loads in the struts are calculated by the FISH functions in “strut_force” after the model has come to equilibrium for each excavation stage. The axial load values are stored in tables for comparison at the end of the calculation. The results are shown in Figure 9 for the preloaded struts and Figure 10 for no preloading.
As shown in Figure 9 for the preload case, the axial load in strut 1 is initially a bit less than the preload value of 200 kN for the first stage, increases at the second stage, and then decreases for the later stages. The axial load in strut 2 increases until the third stage and then decreases. The load in strut 3 (Table 13) increases until the fourth stage, while strut 4 increases through the fifth stage.
The results are similar for the no preload case, as shown in Figure 10.
The change in axial load is related to the movement of the wall during excavation (indicated by the plot in Figure 11 for preloaded struts and in Figure 12 for no preloading). These figures show the evolution of the horizontal displacement at five elevations on the wall (at the top of the wall and at the location of each strut). The top of the wall is shown to move away from the excavation (i.e., in the negative \(x\)-direction) after an initial inward movement, while most of the wall moves into the excavation (i.e., in the positive \(x\)-direction). The movements increase with depth and coincide with the increase in axial forces for the struts.
Figure 13 and Figure 14 plot the \(x\)-displacement contours and axial forces in the struts after the final excavation stage for preloading and no preloading, respectively. Again, as shown in these figures, the movements correspond to the increase in loads in the struts.
The moment distribution and shear forces in the wall, for the analysis with preloaded struts, are shown in Figure 16 and Figure 18, and for the no preloading case in Figure 15 and Figure 17. In both cases, a large bending moment is shown to develop in the wall at the bottom of the excavation.

Figure 7: \(x\)-displacement of diaphragm wall at the end of each excavation stage for preloaded struts.
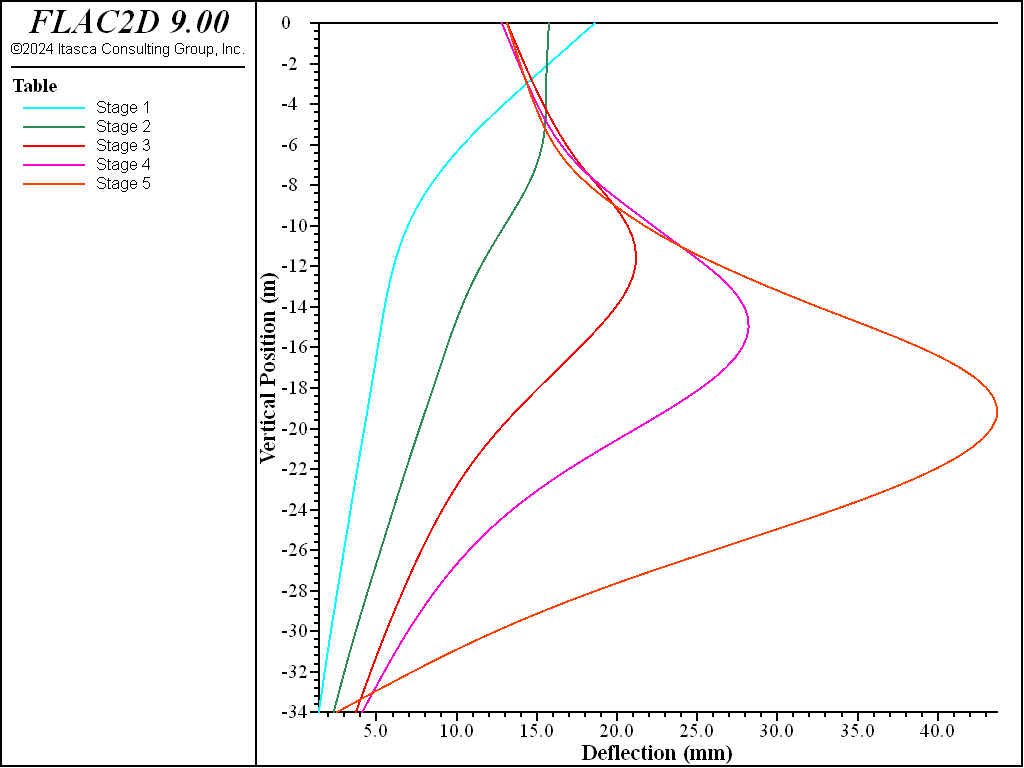
Figure 8: \(x\)-displacement of diaphragm wall at the end of each excavation stage for no preload in struts.
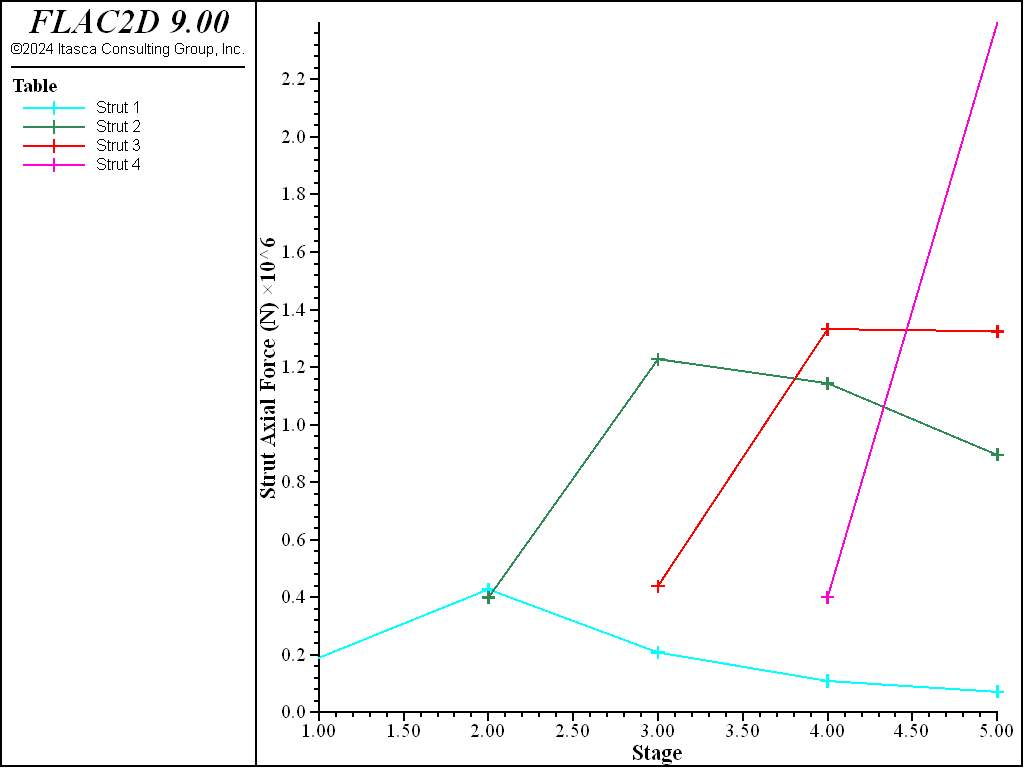
Figure 9: Axial forces in struts at the end of each excavation stage for preloaded struts.
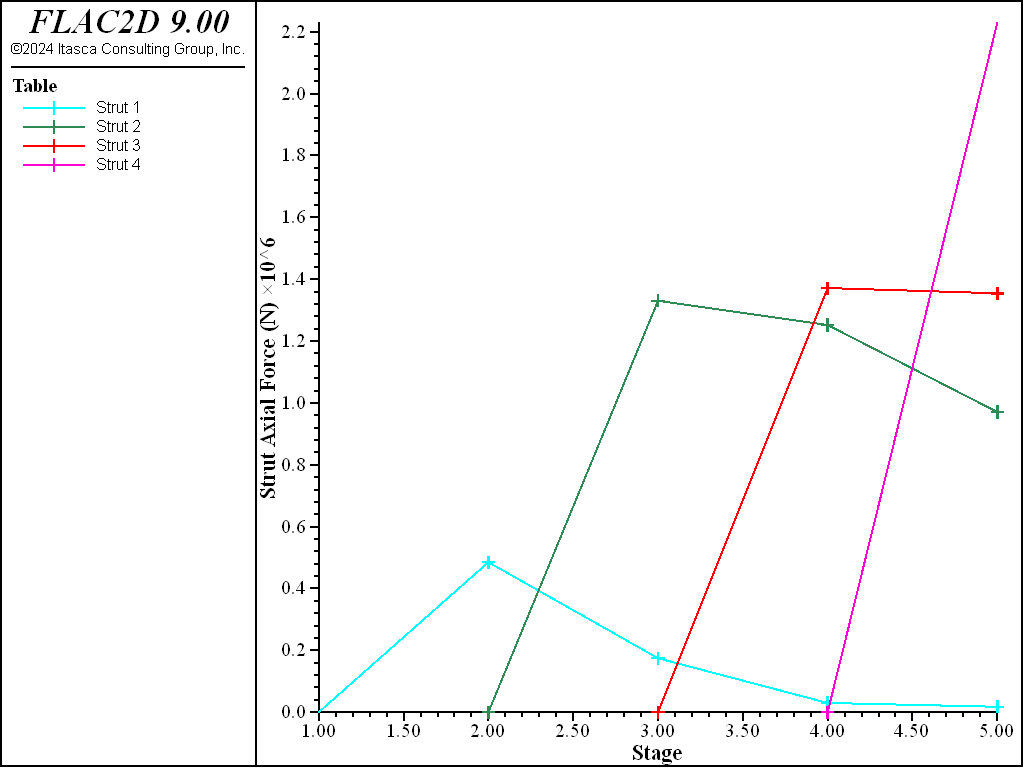
Figure 10: Axial forces in struts at the end of each excavation stage for no preloading in struts.
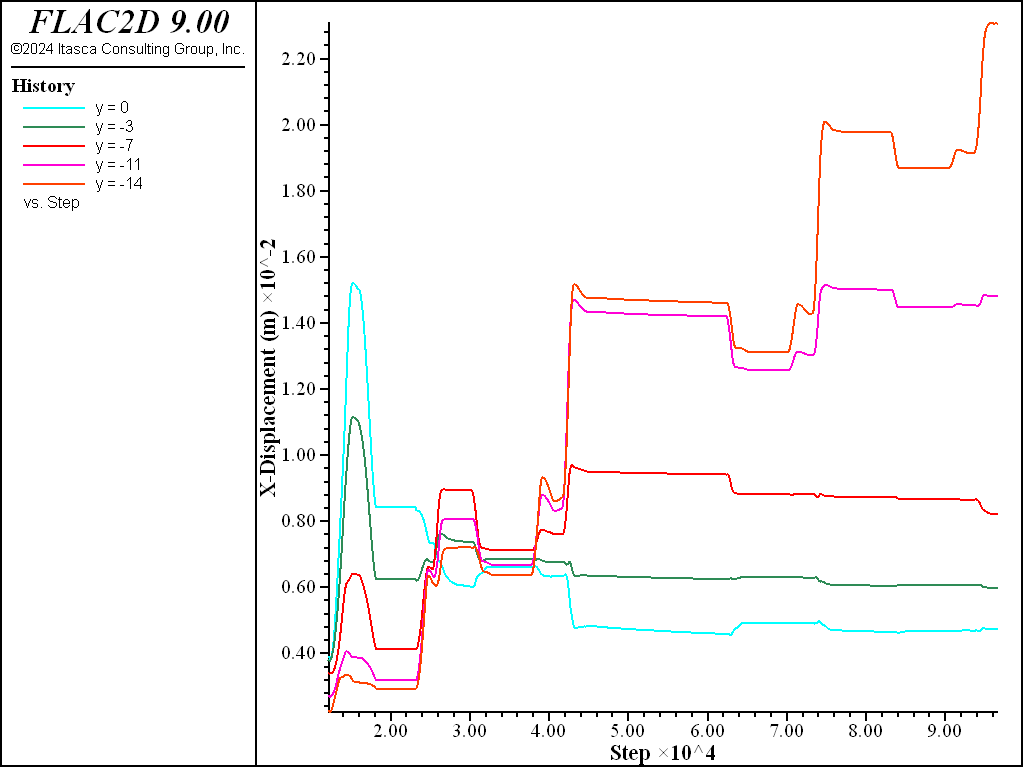
Figure 11: \(x\)-displacement histories at five elevations along the wall for preloaded struts.
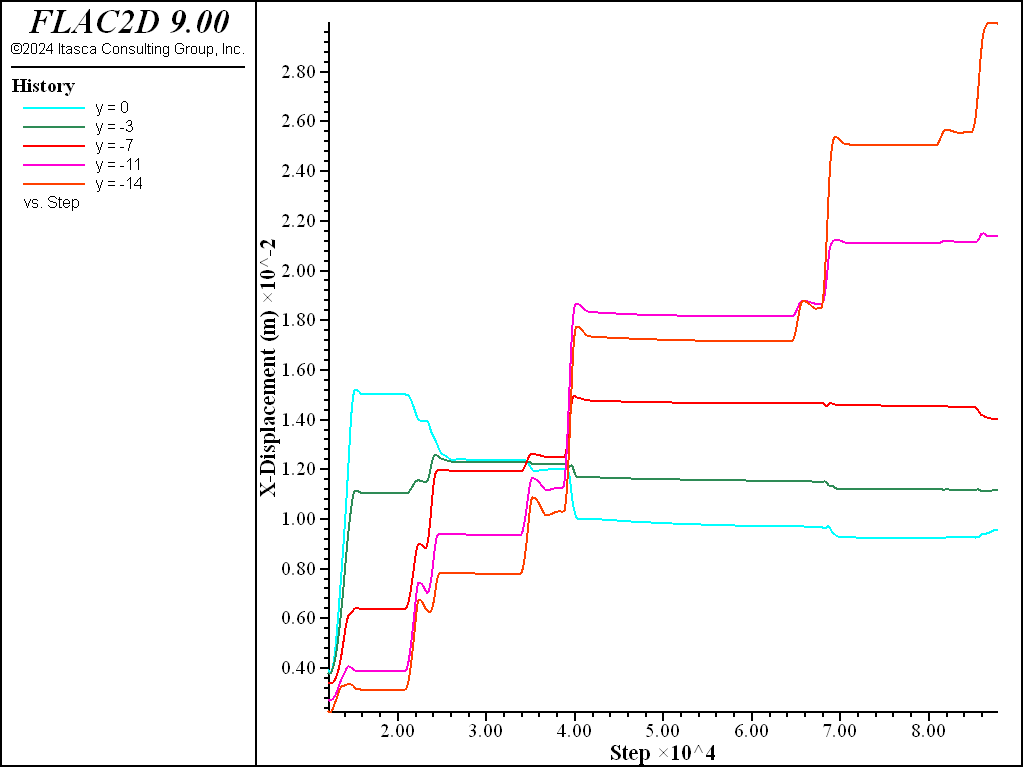
Figure 12: \(x\)-displacement histories at five elevations along the wall no preload in struts.
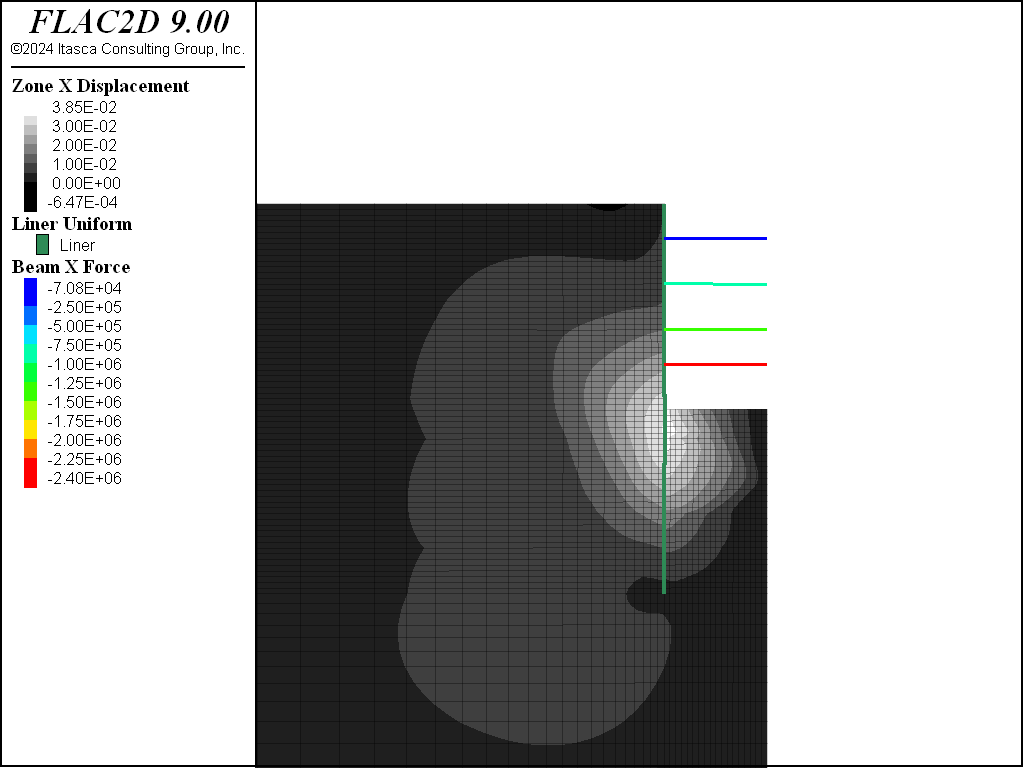
Figure 13: \(x\)-displacement contours in the grid and axial forces in the struts at the final excavation stage for preloaded struts.
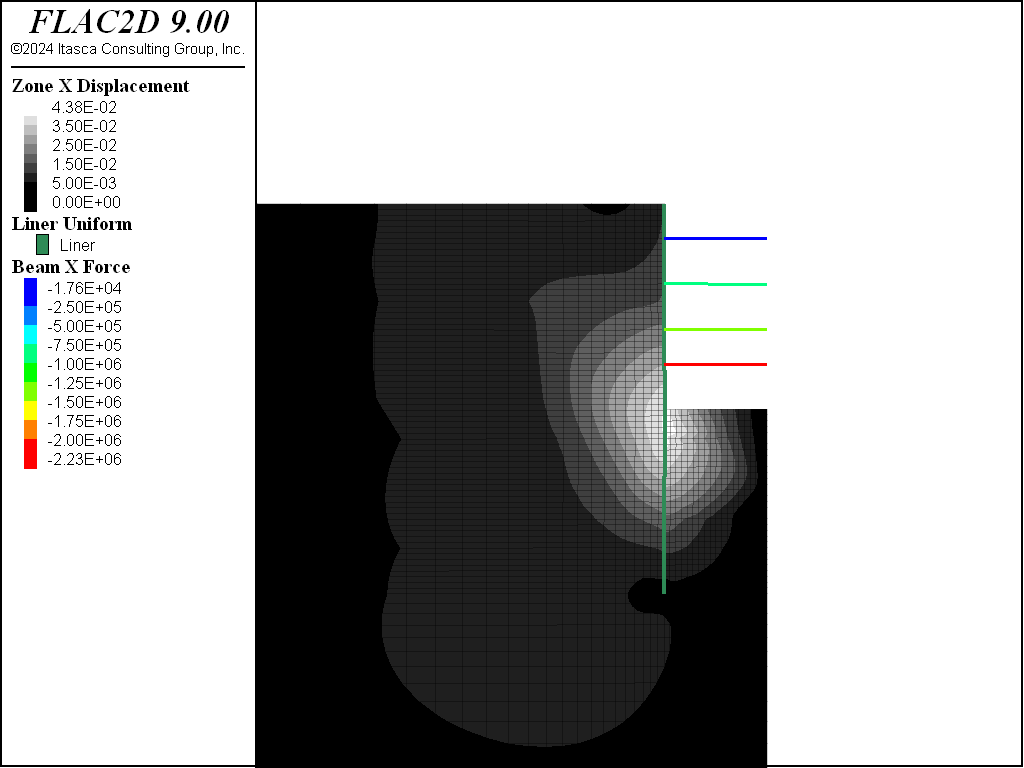
Figure 14: \(x\)-displacement contours in the grid and axial forces in the struts at the final excavation stage for no preload in the struts.

Figure 15: Moments in the diaphragmwall at the final excavation stage (with preloading).
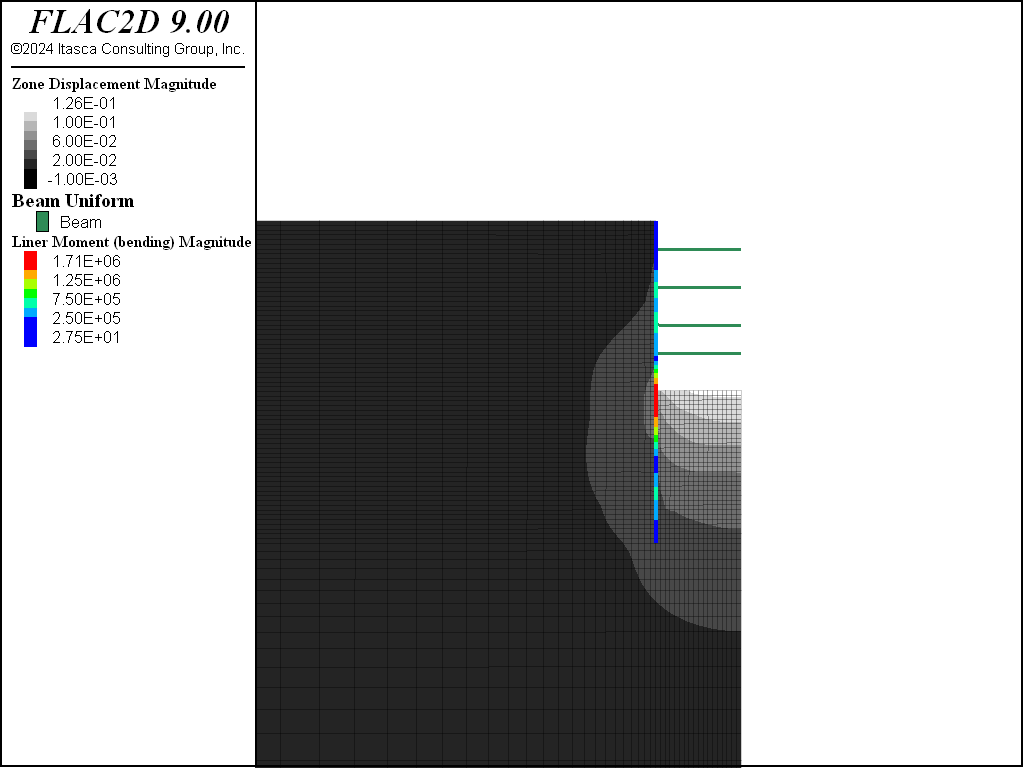
Figure 16: Moments in the diaphragmwall at the final excavation stage (no preloading).

Figure 17: Shear forces in the diaphragm wall at the final excavation stage (with preloading).
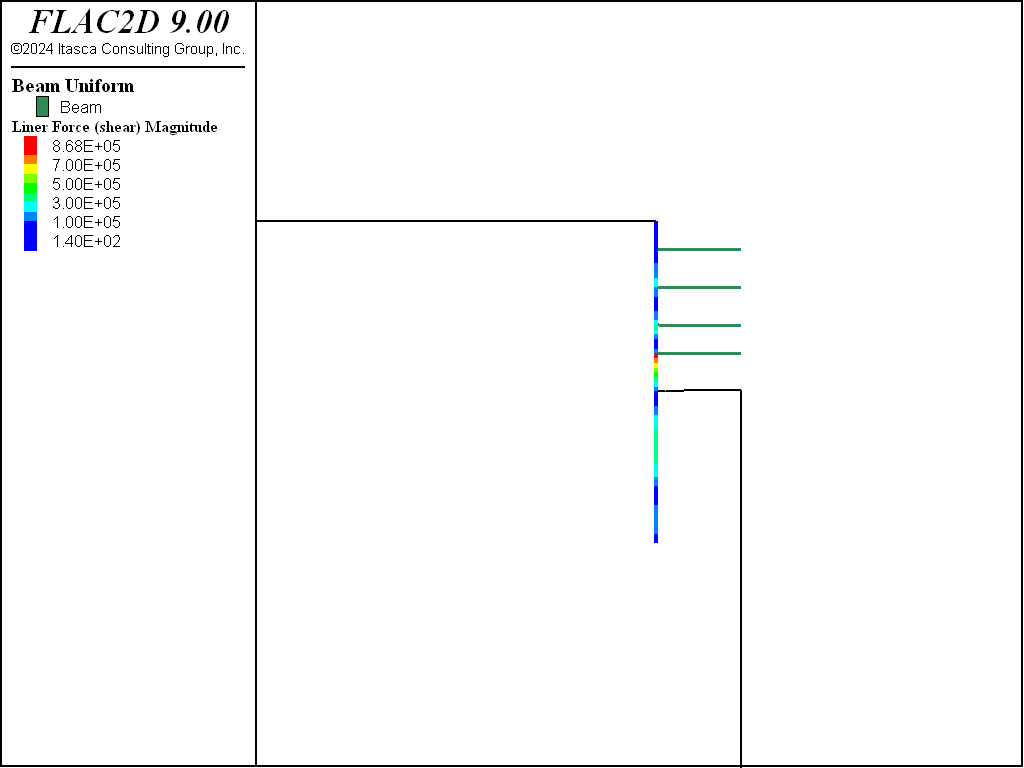
Figure 18: Shear forces in the diaphragm wall at the final excavation stage (no preloading).
References
Clayton, C. R. I., J. Milititsky and R. T. Woods. Earth Pressure and Earth-Retaining Structures. London: Blackie Academic & Professional (1993).
Data Files
initial.dat
model new
program call 'modelpane.dat'

model configure fluid

; wall properties
structure liner cmodel assign elastic
structure liner property density 2000 young 19.2e9 poisson 0.2 ...
  cross-sectional-area 1.0 moi [1.0/12.0]

; soil-wall interface properties
structure liner property coupling-stiffness-normal=1e8 ...
             coupling-stiffness-shear=1e8 ...
             coupling-friction-shear=20.0
structure liner property coupling-stiffness-normal-2=1e8 ...
             coupling-stiffness-shear-2=1e8 ...
             coupling-friction-shear-2=20.0

; ensure consistent coordinate system
; local x is the axial direction, local y is perpendicular
structure node system-local x (0,1) y (1,0)
structure node fix system-local

; fluid properties
zone fluid cmodel assign isotropic
zone fluid property permeability 1e-8 porosity 0.3
zone gridpoint initialize fluid-modulus 0
zone gridpoint initialize fluid-tension 0
zone water density 1000

; boundary conditions
zone face apply velocity-x 0 range position-x -150
zone face apply velocity-x 0 range position-x 9
zone face apply velocity 0 0 range position-y -60

; initial conditions
model gravity 10

; set pore pressure before installing stresses
; effective stress will then be used to calculate the horizontal stresses
zone water plane normal 0,-1 origin 0,-2
; desaturate above the water table
zone gridpoint initialize saturation 0 range position-y -1.99 0

zone initialize-stresses ratio 0.5

; solve mechanical
model fluid active off
model large-strain on

model solve elastic
model save 'initial'
excavate.dat
model restore 'initial'

zone gridpoint initialize displacement 0 0

; -------- dewater --------------
zone group 'dewater' slot 'water' range position-x 0 9

; aquifer at y=-34
zone gridpoint fix pore-pressure range position-y -34.1 -33.9

; water table at y = -5, only on right side of wall
zone gridpoint fix pore-pressure 0 ...
  range position-y -5.1 -4.9 group 'dewater'

; set non-zero fluid modulus
zone gridpoint initialize fluid-modulus 1e4

; fluid only
model fluid on mechanical off
model cycle 5000

; mechanical only
model fluid off mechanical on
zone gridpoint initialize fluid-modulus 0
model solve
model save 'dewater-1'

; ----------- excavate --------------

; make sure we are to the left of the wall
zone history name 'y = 0' displacement-x position -0.01,-0.01
zone history name 'y = -3' displacement-x position -0.01,-3
zone history name 'y = -7' displacement-x position -0.01,-7
zone history name 'y = -11' displacement-x position -0.01,-11
zone history name 'y = -14' displacement-x position -0.01,-14

zone relax excavate range group 'Excavation 1'

model fluid off
model mechanical on
zone gridpoint initialize fluid-modulus 0
model solve

model save 'excavate-1'
preload-1.dat
model restore 'excavate-1'

; We want first node to coincide with node on the wall
; Since this is large strain, the wall node will not
;   be exactly at 0,-3
[wall_node = struct.node.near(0,-3)]
[node_pos = struct.node.pos(wall_node)]
structure beam create by-line [node_pos] (9,-3) group 'Strut 1'
structure beam property spacing 2 young 2.0E11 poisson 0.30 ...
                  cross-sectional-area 0.01739 moi 4.03e-4 ...
                  range group 'Strut 1'

; join to liner
structure node join range group 'Strut 1'

; free rotation
; give a tolerance to the range because nodes move in large strain
structure link attach rotation free range group 'Strut 1' position-x 0 tolerance 0.05

; identify the node on the symmetry plane
; we want to do this, because it will move during pre-loading
structure node group 'SymmetryNode' range group 'Strut 1' position-x 9

; fix dofs on plane of symmetry
structure node fix velocity-y rotation range group 'SymmetryNode'

; apply preload
structure node apply force -1e5 0 range group 'SymmetryNode'
model solve

; remove load and fix
structure node apply remove force range group 'SymmetryNode'
structure node initialize velocity 0 0 range group 'SymmetryNode'
structure node fix velocity-x range group 'SymmetryNode'

model solve

; record liner deflection into tables
program call 'record.fis'
[wall_disp('Stage 1')]

; record strut force into a table
[tab_strut1 = table.create('Strut 1')]
; iput stage, table name, SEL group name
[strut_force(1,'Strut 1', 'Strut 1')]

model save 'preload-1'
Other data files are similar to the above and can be found with the project
record.fis
; make table of y location vs x displacement for liner nodes
fish define wall_disp(table_name)
  local tab = table.create(table_name)
  loop foreach local nd struct.node.list
    ; we only want liner nodes
    local elements = struct.node.element(nd)
    if struct.type(elements(1)) = 'liner'
      ; deflection in mm
      table(tab,struct.node.pos.y(nd)) = struct.node.disp.global(nd,1)*1000
    endif
  end_loop
end

; add struct force to a table for the input stage
fish define strut_force(stage, table_name, struct_group)
  loop foreach local el struct.list
    if struct.group(el) = struct_group
      table(table_name,stage) = math.abs(struct.beam.force(el,1)->x)
    endif
  end_loop
end
Endnotes
⇐ Stresses around a Pressurized Concrete Tunnel (FLAC2D) | Multistage Tunnel Excavation and Support (FLAC2D) ⇒
| Was this helpful? ... | Itasca Software © 2024, Itasca | Updated: Apr 02, 2024 |
