Plot Items in PFC
Name |
Description |
|---|---|
Balls colored by attributes or properties. |
|
CFD balls colored by attributes or properties (PFC3D only). |
|
Thermal balls colored by attributes or properties. |
|
Clumps colored by attributes or properties. |
|
CFD clumps colored by attributes or properties (PFC3D only). |
|
Clump templates colored by attributes or properties. |
|
Thermal clumps colored by attributes or properties. |
|
Contacts colored by attributes or properties. |
|
Thermal contacts colored by attributes or properties. |
|
Contour mechanical contact data on DFN fractures. |
|
Domain geometry. |
|
CFD elements colored by attributes or properties (PFC3D only). |
|
Draw measurement regions colored by attributes. |
|
Rigid blocks colored by attributes or properties. |
|
Rigid block templates colored by attributes or properties |
|
Walls colored by attributes or properties. |
|
Arrows corresponding to thermal walls’ vector attributes or properties. |
Visualizing PFC Model Objects
There are a number of PFC model object whose rendering requires three decisions: what shape should the object take (which may or may not be a choice that is representational of the object, e.g., a “ball” vs. an arrow, either of which might be used for the ball plot item)? what attribute or property of the model object is to be shown? and lastly, should coloration of the object follow a numerical scale, or should it simply assign colors for each successively distinct category to be shown?
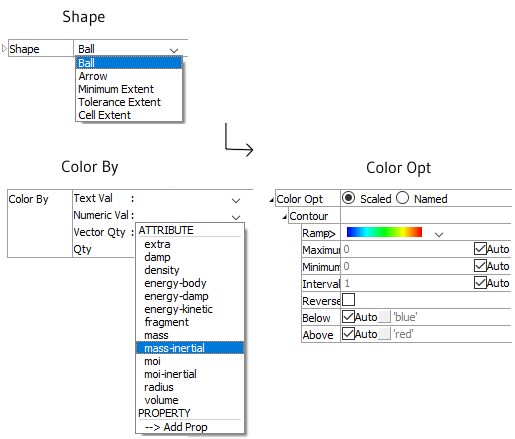
The “Shape, Color By, and Color Opt” Pattern
Model objects with many attributes and properties will require the combination of three plot item attributes — Shape, Color By, and Color Opt — to determine what is rendered. There is a consistency and an order to how these plot item attributes interact.

Shape comes first. It controls the shape used to render the object. In the case of the Ball plot item, for instance, the default option is the “Ball” shape. However, balls may also be rendered as arrows or as extents. Other plot items, similarly, will provide a representational default but also alternatives that illustrate other aspects of the plot item.
Color By comes next. It allows selection of the attribute or property that is of interest when displaying the plot item. There are three categories, and each category may contain many choices. The categories are: textual values (“Text Val”), numeric values (“Numeric Val”), and vector quantities (“Vector Qty”). The ball plot item, for instance, offers 30 choices across all three categories. In addition, each category provides the facility to add a user-defined property as well. Any selection in this field is exclusive of all others; only one attribute or property is selected at any time.
Color Opt comes last. It will be initially, automatically set in accord with the selection made for the Color By attribute. If a “Text Val” is picked, the field is set to “Named” and controls for handling the plot item color list are dynamically provided with the field. If either a “Numeric Val” or “Vector Qty” is picked, controls of handling the color contour are dynamically provided with the field. The automatic selection is likeliest to be the desired setting. However, there are contexts where there is a need to invert the relations (requesting “Named” output for a “Numeric Val”, for instance).
| Was this helpful? ... | Itasca Software © 2024, Itasca | Updated: Nov 12, 2025 |
