Command-Driven Plotting Workflow
In the event that command-driven plotting is to be including in a modeling run, the following steps are suggested as a method for constructing the commands to be used.
Construct a plot with plot items and view adjustments as needed.
Export the plot to a data file.
At this point, review the exported data file and incorporate it in part or in its entirety into the command sequence under construction. If the plotting sequence is one where changes must occur (for instance, as part of a movie where the model view shifts, magnification changes, colors change, etc.), it is recommended that the desired change be made interactively, followed by export of a second data file. By comparing the exported data files, one can relatively easily identify the keywords and values associated with the modification made to the plot.
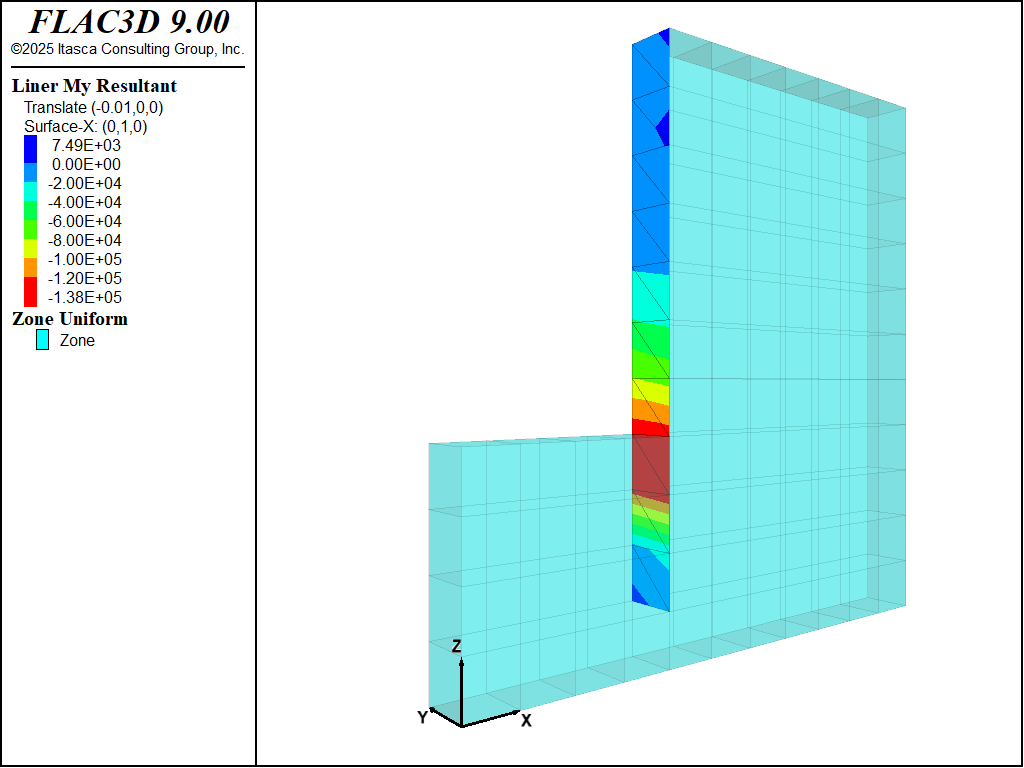
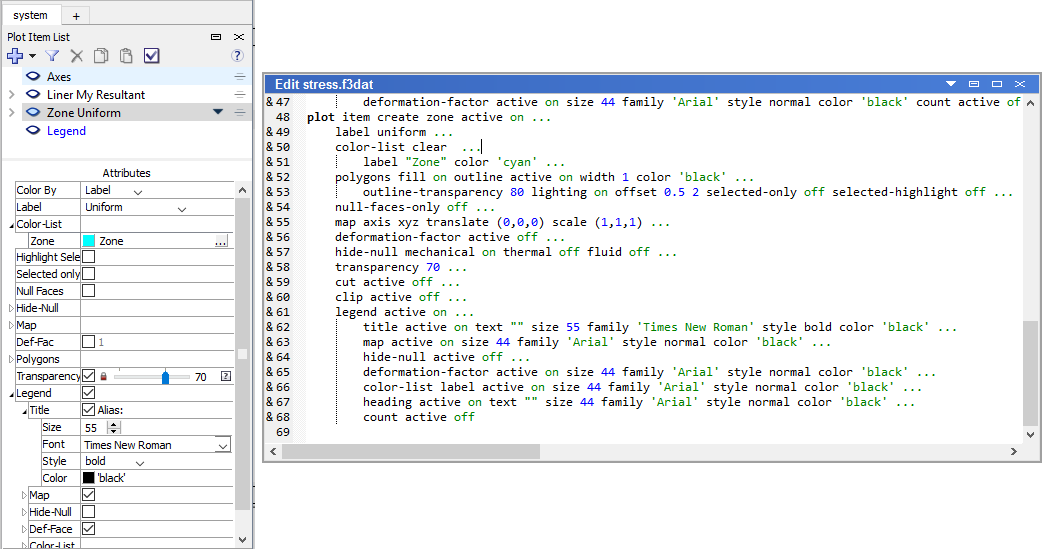
The images above illustrate the process. The first image shows a typical plot (this stress resultant plot comes from the example of an embedded retaining wall). The second image shows the state of the Control Panel for the plot when the “Zone Uniform” item is selected. Adjacent to that is the portion of the data file exported from the plot that contains the plot item create command that is responsible for creating the “Zone Uniform” plot item (click the image to enlarge to full resolution, if needed). There is a very close correspondence between the keywords in the command and the “Attribute” labels in the Control Panel. Accessing the command switches for plots this way is — as is the case with plotting itself — much faster than trying to construct a plot directly from reference information on the command.
Plot Data File Structure
Exported plot data files will follow a uniform structure.
Commands that affect the plot as a whole are written (
plot create,plot clear, etc.).Next the
plot viewcommand (or possibly commands) controlling the view appears.Last, the
plot itemcommands that “populate” the plot are shown.
Use of indentation for the switches facilitates identification of the plot’s command structure. As can be seen when reviewing any exported plot, there are an extensive number of switches that govern the appearance of plot items. However, it is likely that only a few plot item switches will be pertinent to the user’s goals in manipulating the plot.
See also Switch/Keyword Options for lists of commonly accessed switch options (colors, line styles, etc.).
For reference, the complete exported file for the above plot is listed below.
plot create
plot clear
plot active on
plot target active on
plot background 'white'
plot outline active on width 2 color 'black'
plot legend active true heading size 94 color 'black' copyright size 40 color 'black' ...
    placement left size 25,50 ...
    step active false ...
    time-real active false ...
    time-model active false ...
    title-customer active false ...
    view-info active false
plot title-job active false
plot title active false
plot view projection perspective magnification 0.97710707 ...
    center (5,2,4.9) eye (-6.3722554,-11.552926,4.9) roll 0 ...
    clip-front -10000000000 clip-back 10000000000
plot item create axes active on ...
    axis-x color 'black' draw-positive on draw-negative off label-positive 'X' ...
    axis-y color 'black' draw-positive on draw-negative off label-positive 'Y' ...
    axis-z color 'black' draw-positive on draw-negative off label-positive 'Z' ...
    position (0,0,0) size 1 ...
    font size 10 family 'Arial' style bold ...
    transparency 0 ...
    legend active off
plot item create structure-liner active on ...
    contour resultants ...
    ramp rainbow ...
        minimum automatic maximum automatic interval automatic ...
        reversed on above automatic below automatic resultant my surface-x (0,1,0) use-engine-data off ...
    shrink 1 ...
    map axis xyz rotate (0,0,0) translate (-0.01,0,0) scale (1,1,1) ...
    deformation-factor active off ...
    marker none ...
    system none ...
    polygons fill on outline active on width 1 color 'black' ...
        polygon-transparency 0 ...
        outline-transparency 80 lighting off offset 0.5 2 ...
    transparency 0 ...
    cut active off ...
    clip active off ...
    legend active on ...
        title active true text "" size 55 family 'Times New Roman' style bold color 'black' ...
        shrink-caption active false ...
        labels active true size 44 family 'Arial' style normal color 'black' ...
            labels-maximum 20  format 0  precision 2 ...
        map active true size 44 family 'Arial' style normal color 'black' ...
        deformation-factor active true size 44 family 'Arial' style normal color 'black' count active false
plot item create zone active on ...
    label uniform ...
    global on clear  ...
    label "Zone" active on color 'cyan' ...
    polygons fill on outline active on width 1 color 'black' ...
        polygon-transparency 0 ...
        outline-transparency 80 lighting on offset 0.5 2 ...
    cut-line width 1 selected-only false selected-highlight false selected-only false ...
    null-faces-only off ...
    map axis xyz rotate (0,0,0) translate (0,0,0) scale (1,1,1) ...
    deformation-factor active off ...
    hide-null mechanical on thermal off fluid off ...
    transparency 70 ...
    cut active off ...
    clip active off ...
    legend active on ...
        title active true text "" size 55 family 'Times New Roman' style bold color 'black' ...
        map active true size 44 family 'Arial' style normal color 'black' ...
        hide-null active false ...
        deformation-factor active true size 44 family 'Arial' style normal color 'black' ...
        count active false label active true size 44 family 'Arial' style normal color 'black' ...
        heading active true text "" size 44 family 'Arial' style normal color 'black'
| Was this helpful? ... | Itasca Software © 2024, Itasca | Updated: Nov 12, 2025 |
