Pull-Test for a Grouted Cable Anchor in a PFC Rigid Block Model
Problem Statement
Note
The project file for this example may be viewed/run in PFC.[1] The data file used is shown at the end of this example.
The most common way to determine cable bolt properties is to perform pull-out tests on small segments of grouted cables in the field. Typically, segments from 10 to 50 cm in length are grouted into boreholes. The ends of these segments are pulled with a jack mounted to the surface of the tunnel, and connected to the cable via a barrel-and-wedge type anchor. The force applied to the cable and the deformation of the cable are plotted to produce an axial force/deflection curve. From this curve, the peak shear strength of the grout bond is normally determined and converted to a strength in tons/m cable length.
In this example, we simulate a pull-test on a single 15.2 mm diameter cable. The cable material properties are:
cable area |
181 mm^2 |
cable modulus |
98.6 GPa |
cable bond length |
17.7 m |
cable tensile capacity |
0.5 MN |
We select the following properties for the grout:
grout bond stiffness |
112 MN/m/m |
grout cohesive strength |
0.175 MN/m |
These values are representative of a weak grout (e.g., see Hyett et al. 1992). Note that the cable length and grout strength are selected for rapid execution of the model. The purpose is to illustrate the performance of the cable elements.
The cable is divided into 10 segments. The pull force is applied by specifying a velocity for the first (top) node. The test is first run to a displacement of 30 mm of the top cable node without confinement.
The FISH function pull_force is used to monitor the pull force on the cable (pull force per cable length). The pull force is determined from the sum of applied forces that develop on the rigid blocks as the cable is pulled. The data file for this model is shown in pullout.dat
Figure 1 displays the axial force distribution in the cable (left-hand side) and the cable nodes vertical displacement distribution (right-hand side) at the end of the test. A plot of the total pull force versus displacement resulting from the test is shown in Figure 2. As this figure shows, the peak load is very similar to the input value for grout cohesive strength.
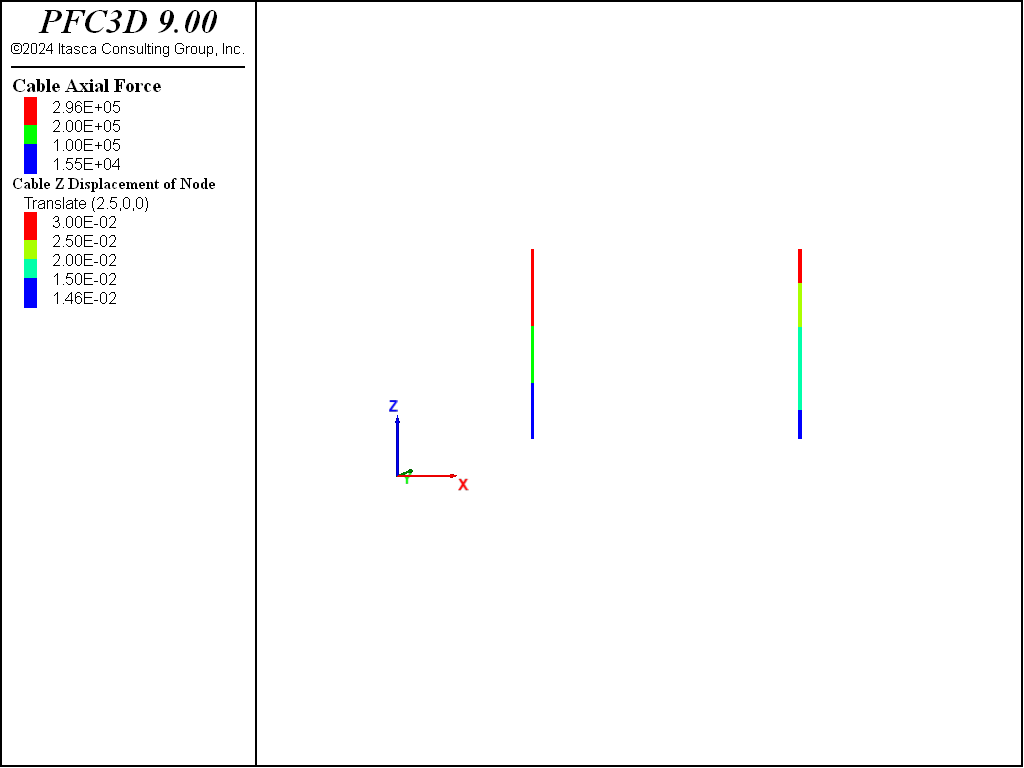
Figure 1: Axial force (left) and displacement (right) in the cable for the pull test.
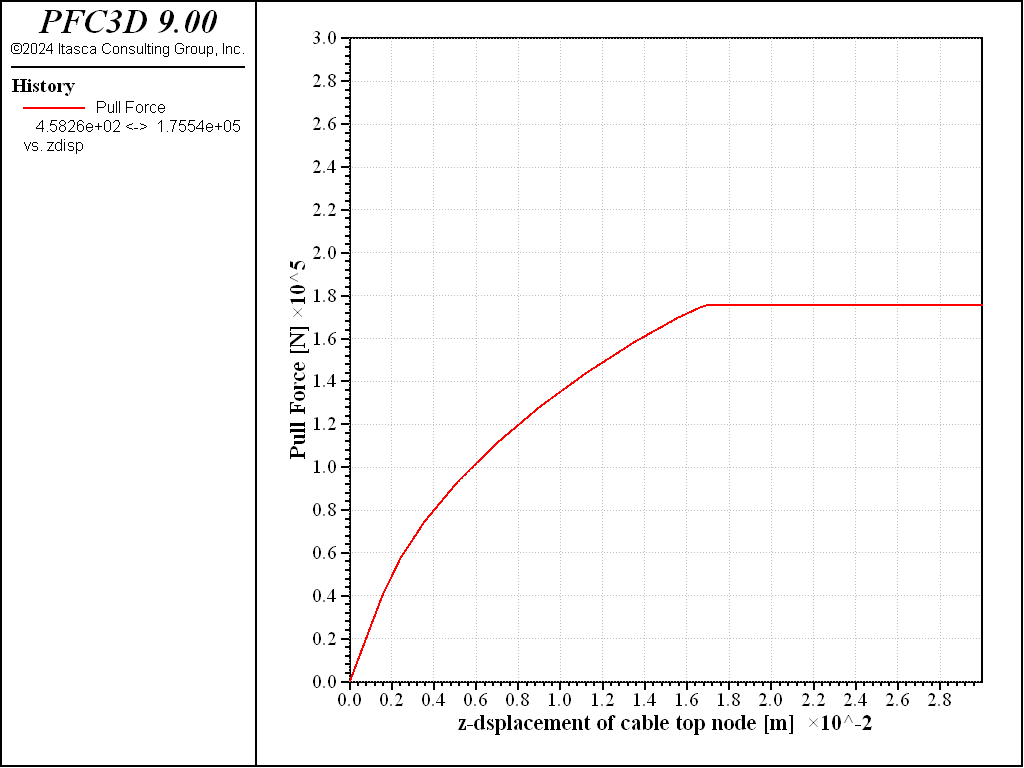
Figure 2: Pull force in N/m versus cable top displacement in meters.
Figure 3 displays the grout confining stress (left-hand side) and shear stress (right-hand side ) distributions in the cable at the end of the test. A plot of the grout shear stress at the top and bottom of the cable versus displacement at the top of the cable is shown in Figure 4. As this figure shows, the peak grout shear stress corresponds to the input value for grout cohesive strength.
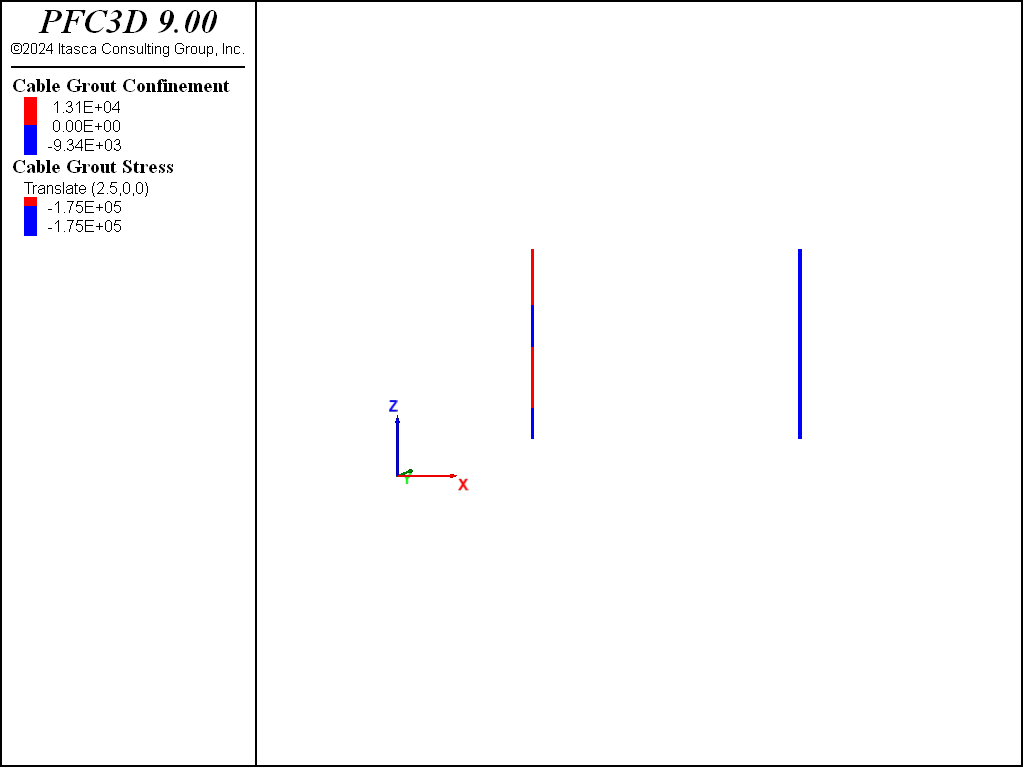
Figure 3: Confining (left) and shear (right) stress in the grout (no confinement).
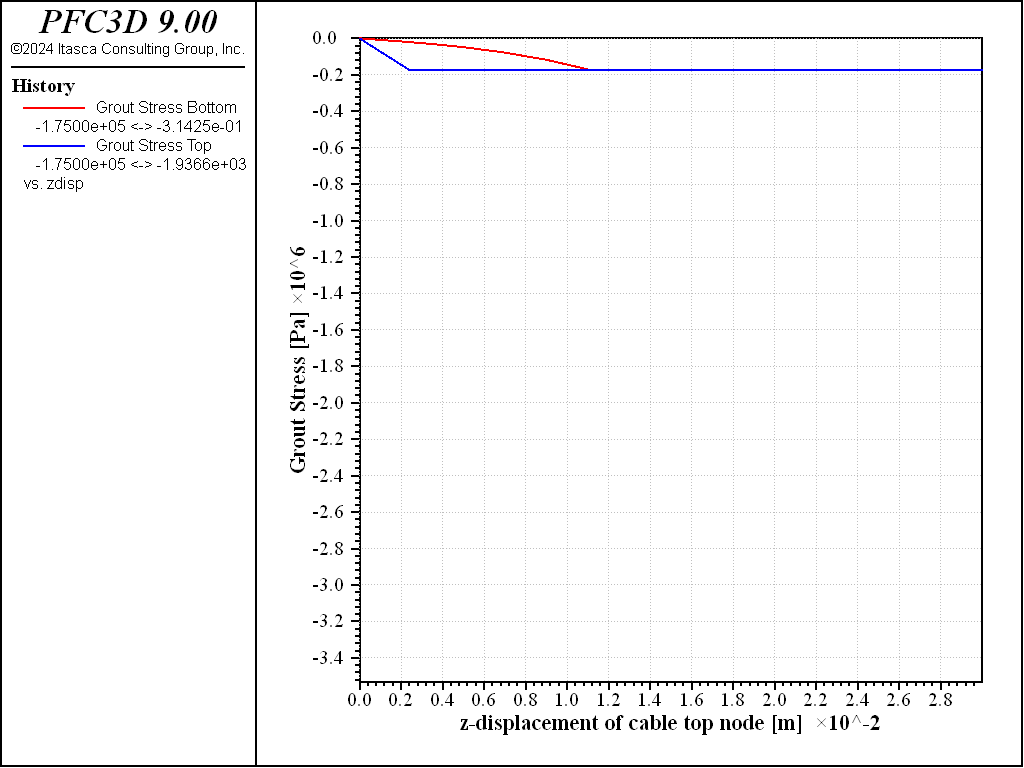
Figure 4: Grout shear stress in Pa versus cable top displacement in meters.
The same model is run again, but with a confinment of 2MPa. Histories of the pull force and grout shear stress are shown in Figure 5 and Figure 6
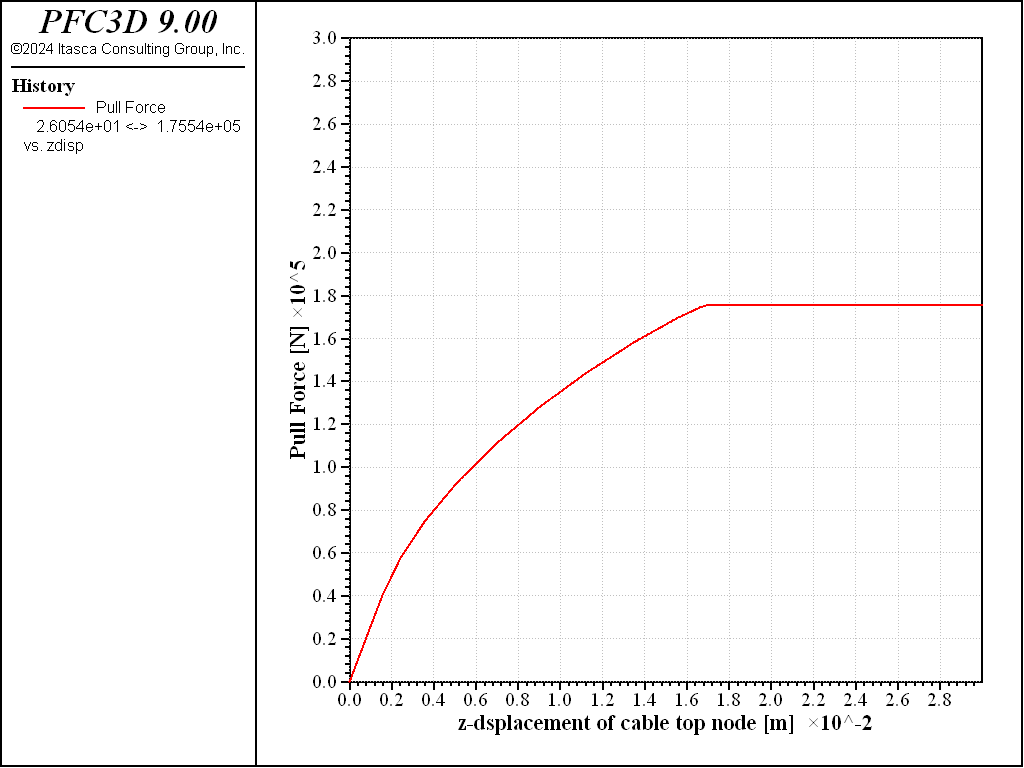
Figure 5: Pull force in N/m versus cable top displacement in meters (2MPa confinement).
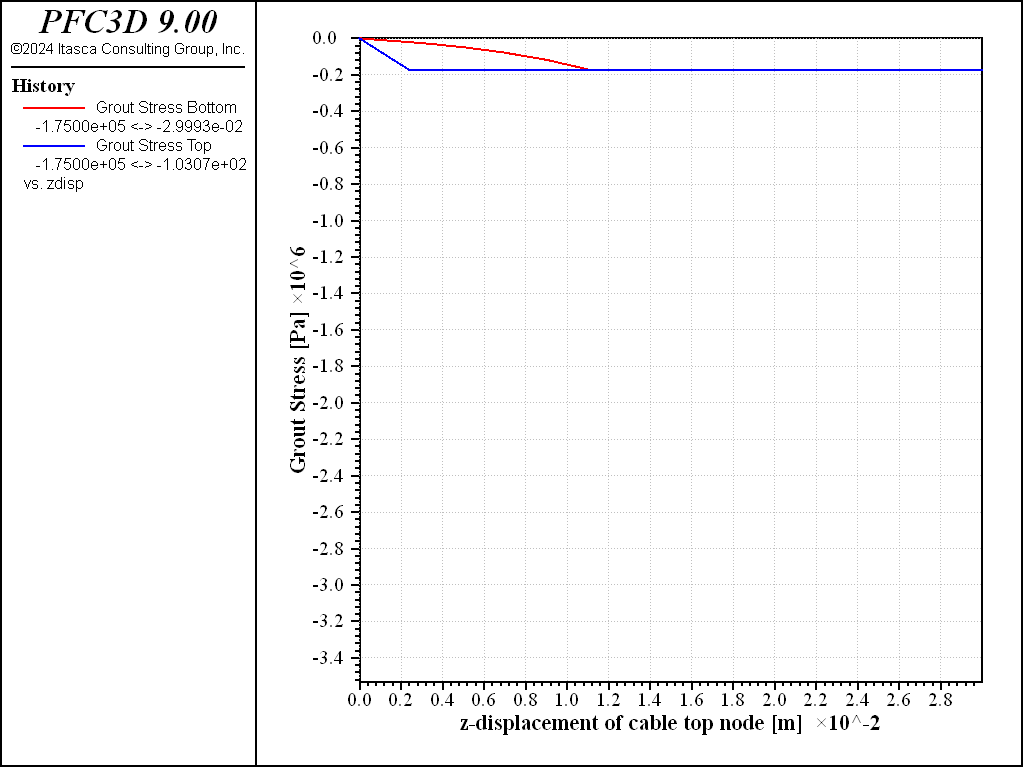
Figure 6: Grout shear stress in Pa versus cable top displacement in meters (2MPa confinement).
The cable shear bond strength will, in general, increase with increasing effective pressure acting on the cable. In the above model that does not occur because the frictional strength of the grout was set to 0. To test the dependency on confining stress, the same model is run again under 2MPa confinement, but a non-zero grout friction and perimeter are assigned. The friction angle of the grout is set to 30◦. The perimeter is set assuming the hole diameter is twice the cable diameter. Inline FISH is used to perform the calculation. The corresponding histories of the pull force and grout stress of this test are shown in Figure 7 and Figure 8. You can see that this bolt is indeed stronger than the bolt with zero frictional grout strength.
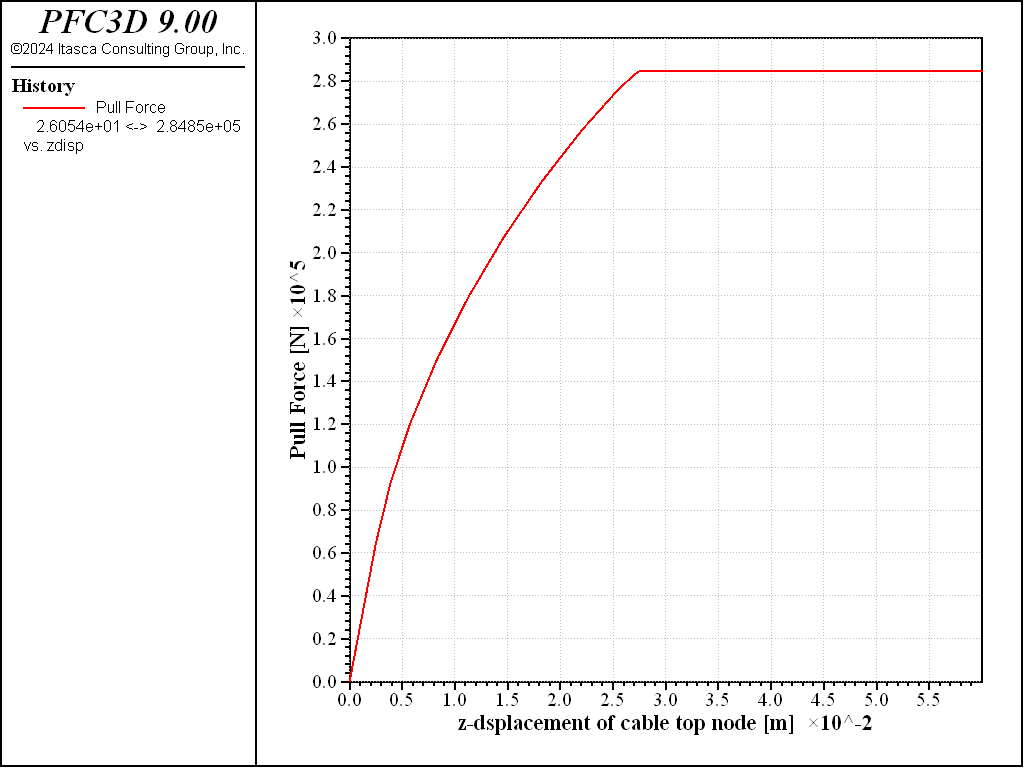
Figure 7: Pull force in N/m versus cable top displacement in meters (2MPa confinement,non-zero friction).
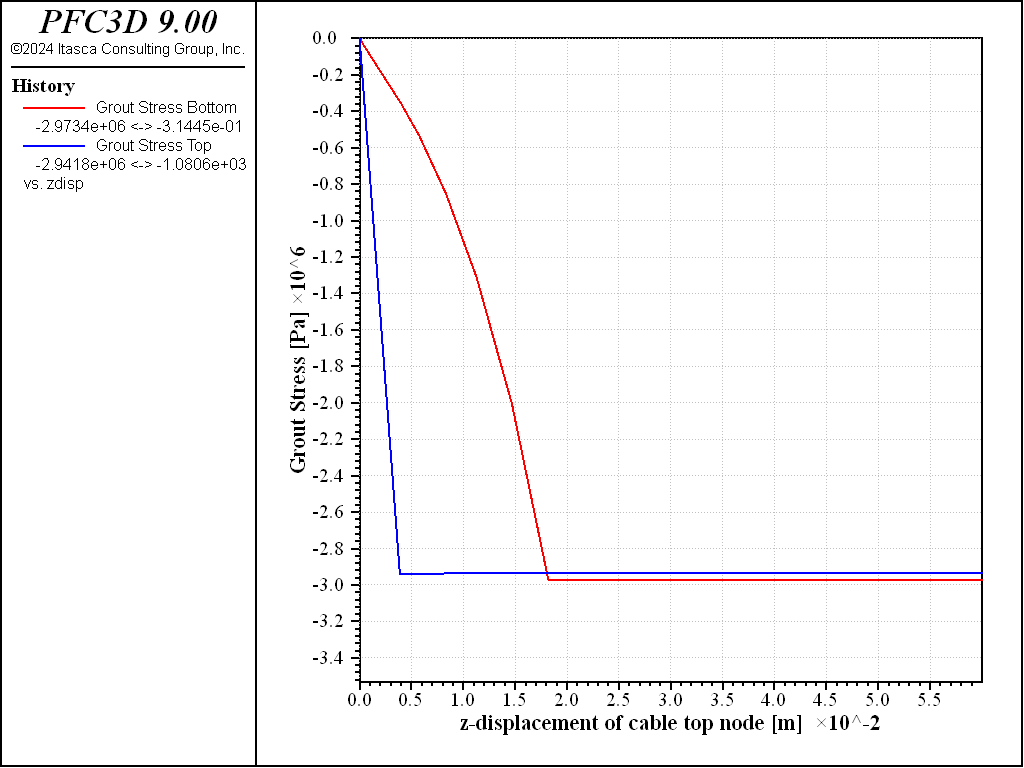
Figure 8: Grout shear stress in Pa versus cable top displacement in meters (2MPa confinement,non-zero friction).
References
Hyett, A. J., W. F. Bawden and R. D. Reichert. “The Effect of Rock Mass Confinement on the Bond Strength of Fully Grouted Cable Bolts,” Int. J. Rock Mech. Min. Sci. & Geomech. Abstr., 29(5), 503-524 (1992).
Data Files
pullout.dat
model new
model random 10000
model large-strain on
model domain extent -5 5

; Construct geometry
[lb = vector(-1.,-1.,-2.)]
[ub = vector(1.,1.,0.)]
geometry generate box [lb->x] [ub->x] ...
                      [lb->y] [ub->y] ...
                      [lb->z] [ub->z]
rblock construct from-geometry maximum-edge 0.5

; Identify boundaries
rblock facet group '-x' slot 'boundary' ...
                        range position-x [lb->x] by rblock-vertex
rblock facet group '+x' slot 'boundary' ...
                        range position-x [ub->x] by rblock-vertex
rblock facet group '-y' slot 'boundary' ...
                        range position-y [lb->y] by rblock-vertex
rblock facet group '+y' slot 'boundary' ...
                        range position-y [ub->y] by rblock-vertex
rblock facet group '-z' slot 'boundary' ...
                        range position-z [lb->z] by rblock-vertex
rblock facet group '+z' slot 'boundary' ...
                        range position-z [ub->z] by rblock-vertex

; Scale the rigid blocks so that they overlap initially.
rblock dilate expand 0.0001 keep-inertial

; Set the rigid block damping and density
rblock attribute density 2500 damp 0.7

; Use the contact area
[global facetTotal = 0.05]
rblock contact-resolution update-area true accumulate-stress true ...
                          facet-total [facetTotal]

; Specify the springnetwork model properties.
contact cmat default model springnetwork ...
                     method compute-stiffness emod 1e9 poisson 0.25 ...
                     property sn_ten 1e20 sn_coh 1e20

; create the contacts
model clean
; Ensure that the contact areas are unchanged
contact method area

; Bond the contacts
contact method bond

; Boundary conditions
rblock fix velocity-x spin range group '-x' by rblock-facet
rblock fix velocity-x spin range group '+x' by rblock-facet
rblock fix velocity-y spin range group '-y' by rblock-facet
rblock fix velocity-y spin range group '+y' by rblock-facet
rblock fix velocity-z spin range group '-z' by rblock-facet
rblock fix velocity-z spin range group '+z' by rblock-facet

structure cable create by-line 0,0,-1.77  0,0,-0.01 segments 10
structure cable property cross-sectional-area 181e-6      ...
                         young 98.6e9  yield-tension 5e6  ...
                         grout-stiffness 1.12e8   grout-cohesion 1.75e5
; Apply velocity in cable local coordinates: x is axial
structure node fix velocity-x range position-z -0.02 0.02
structure node initialize velocity-x 0.05 range position-z -0.02 0.02

;
fish define pull_force
    ; Sum the applied force on the blocks
    local sum = 0.0
    loop foreach local b rblock.list
        sum = sum + rblock.force.app.z(b)
    endloop
    pull_force = sum / 1.77 ; bolt length
end
;
fish history name 'pull force' pull_force

structure node history name 'zdisp' displacement-z position 0 0 0
structure cable history name 'grout stress' grout-stress position 0 0 -1
structure cable history name 'grout stress top' grout-stress position 0 0 0

model save 'pullout-ini'

model solve time [3e-2/0.05]
model save 'pullout1'

model restore 'pullout-ini'

; Apply lateral confining stress of 2MPa
rblock tractions constant -2e6 -2e6 0 0 0 0

model solve time [3e-2/0.05]
model save 'pullout2'

model restore 'pullout-ini'
; apply lateral confining stress of 6MPa
rblock tractions constant -2e6 -2e6 0 0 0 0
; Add frictional strength - assume hole radius is twice cable radius
structure cable property ...
                grout-friction 30.0 ...
                grout-perimeter [2.0*math.pi*2.0*math.sqrt(181e-6/math.pi)]
model solve time [6e-2/0.05]
model save 'pullout3'
Endnote
| Was this helpful? ... | Itasca Software © 2024, Itasca | Updated: Nov 12, 2025 |
