Shear Wave Propagation in a Vertical Bar
Note
To view this project in FLAC3D, use the menu command . The main data files is shown at the end of this example. The remaining data files can be found in the project.
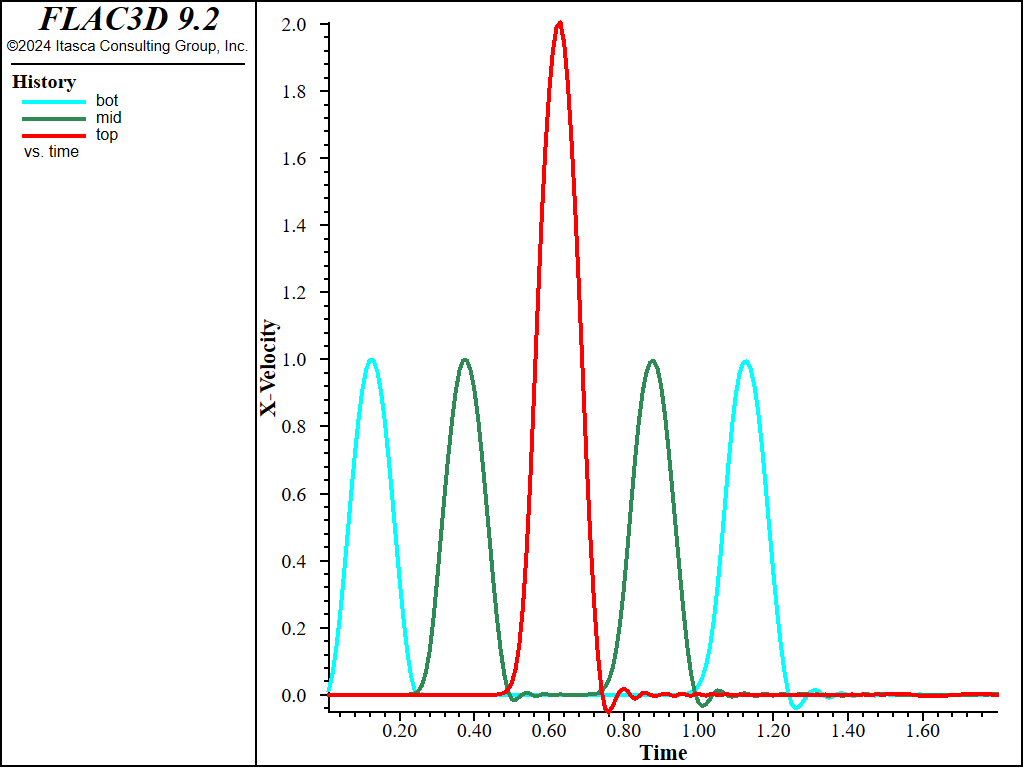
This is a small, simple example created to illustrate wave input at a quiet boundary. A pulse is applied as a stress history to the bottom of a vertical, 50 m high bar. The bottom of the bar is declared “quiet” in both horizontal directions, and the top is free. The properties are chosen such that the shear wave speed is 100 m/sec, and the product \(\rho C_s\) is 105. The amplitude of the stress pulse is set, therefore, to 2 \(\times\) 105, according to the relation that converts normal velocity to applied normal stress, in order to generate a velocity amplitude of 1 m/sec in the bar. Figure 1 shows time histories of \(x\)-velocity at the base, middle, and top of the column. The amplitude of the outgoing wave is seen to be 1 m/sec, as expected. The first three pulses in Figure 1 correspond, in order, to the outgoing waves at base, middle, and top. The final two pulses correspond to waves reflected from the free surface, measured at the middle and base, respectively. The velocity-doubling effect of a free surface can be seen, as can the lack of waves after a time of about 1.3 seconds, which confirms that the quiet base is working correctly.

Figure 1: Primary and reflected waves in a bar—stress input through a quiet boundary.
Data File
ShearWaveOnVerticalBar.dat
;---------------------------------------------------------------------
;           Script file for Dynamic Problem
;           Shear wave propagation in a vertical bar
;---------------------------------------------------------------------
model new
model large-strain off
fish automatic-create off
model title "Shear wave propagation in a vertical bar"
model configure dynamic
;
; Create zones
zone create brick size 1,1,50
zone face skin ; Name boundaries
;
; Assign model and properties
zone cmodel assign elastic
zone property shear 1e7 bulk 2e7 density 1000
;
; Boundary Conditions
zone gridpoint fix velocity-z

zone face apply quiet-dip range group 'Bottom'
zone face apply quiet-strike range group 'Bottom'
fish define wave
    wave = 0.5 * ...
           (1.0 - math.cos(8.0*math.pi*math.min(zone.dynamic.time.total,0.25)))
end
zone face apply stress-xz -2e5 fish wave range group 'Bottom'
;
; Histories
zone history name='bot' velocity-x position (0,0, 0)
zone history name='mid' velocity-x position (0,0,25)
zone history name='top' velocity-x position (0,0,50)
model history name='time' dynamic time-total
;
; Solve to time 1.8
zone dynamic safety-factor 20 ; Smooth out the curves a bit, just for plotting
model solve time-total 1.8
model save 'ShearWaveOnVerticalBar'
| Was this helpful? ... | Itasca Software © 2024, Itasca | Updated: Dec 05, 2024 |
