
Fracture Stereonet
Description
Stereonet poles orientations.
Attributes
Display
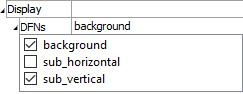
Set display off/on for distinct sets.
Display (checkbox on item name): Check an item in the list to include it in the display. Uncheck the item to hide it.
Projection
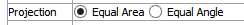
Set the stereonet projection.
Hemisphere
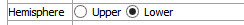
Set which hemisphere to display on the stereonet.
Density
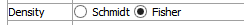
Set which density to display on the stereonet.
Resolution
Set the resolution of ???
Contours
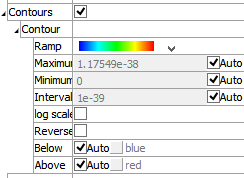
Include contours when checked.
Contour: A container for settings that control contouring options.
Ramp: Set the color ramp to use for rendering. The five options, in order shown in the select box, are: rainbow (blue to red), grayscale, blue-white-red, blue-cyan-white-yellow-red, green-white-red.
Maximum: Set the highest value (right end) of the color ramp automatically (auto checked) or with a specified value (auto unchecked). Values above Maximum are filled with the Above color.
Minimum: Set the lowest value (left end) of the color ramp automatically (auto checked) or with a specified value (auto unchecked). Values below Minimum are filled with the Below color.
Interval: Specify the number of color intervals used in when rendering; this value defaults to a number between 8-16 if auto is checked.
Log Scale: Specify that the color intervals are logarithmically spaced when checked.
Reversed: Reverse the color sequence of the color ramp when checked.
Below: Specify which color to use for values below the Minimum. The left end of the color ramp is used with auto checked. When unchecked, the color swatch control specifies the color.
Above: Specify which color to use for values above the Maximum. The right end of the color ramp is used with auto checked. When unchecked, the color swatch control specifies the color.
Points
Include points ??? when checked.
Grid
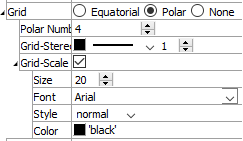
Set the attributes of the rendered stereonet grid.
Grid: Set grid orientation to one of: “Equatorial”, “Polar”, or None. “None” has the effect of turning off grid display.
For Equatorial grids:
Parallels: Set the number of parallels in the grid.
Meridians: Set the number of meridians in the grid.
For Polar grids:
Polar Number: Set the number of polar rings.Additional elements common to Equatorial and Polar grids:
Grid-Stereo: Set the color, line style, and line thickness of the grid.
Grid-Scale: Include (checked) scale labels for the grid, with additional controls for size, font face, style, and color of text to be used for scale labels.
Border
Set display of the plot item border.
Border: Display the border when checked. This setting contains the following setting as well.
Line: Set thickness and color of the line used to render the border.
Position
Set the plot item position.
Position: Specifies the bottom and left positions, respectively, of the item’s bottom-left corner, as a percentage of the available rendering area.
If these values are set such that, with the current size setting, the item would exceed the available rendering area, then the size will be automatically downwardly adjusted to fit. Also see the size attribute.
Size
Set the size of the plot item.
Size: Specify \(x\) and \(y\) size, respectively, of the item, as a percentage of the available rendering area. Also see the position attribute.
Transparency
Set the transparency of the plot item. This setting is not available on 2D model objects.
Transparency: Apply transparency (checked) to the item. When on, transparency is set to a default value of 70 and is “locked.” When locked, the available range of transparency is constrained to 70 (lowest, somewhat transparent) to 100 (highest, completely invisible). To access the full range of transparency values (0-100), press the lock icon to “unlock” the transparency range; the icon changes accordingly (
).
Use the help button to get help with this specific attribute.
Note
Users should be cautioned that values lower than 70 tend to be imperceptibly “less” transparent and they may result in depth perspectives that can seem strange or incorrect.
Legend
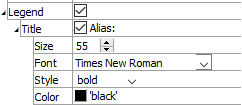
Set display of the item in the plot legend. All plot items, at minimum, have a Title attribute.
Legend: Show (checked) all information about the plot item in the legend.
Title: Show (checked) the title of the plot item in the legend. The “Alias:” field may be used to specify a custom title for the item.
Size: Set the size of text in the legend.
Font: Set the font face used for the text.
Style: Set the text style (the options are normal, bold, italic, bold-italic).
Color: Set the text color.
Beneath Title, the Fracture Stereonet plot item also provides controls in the legend for Hemispheres, Grid-Stereo, Pole, Contour, and Colors (which contains two child items: Label and Heading). The sub-attributes of each are the same as those for Title.
| Was this helpful? ... | PFC 6.0 © 2019, Itasca | Updated: Nov 19, 2021 |