
Profile Plot Item
Description
Chart a grid attribute along a line defined in space. The first few attributes of this plot item are contingent on the first attribute (Type).
Attributes
Type
Set the profile display to either “chart” or “line” type.
Value
Select the zone value to display. Additional attribute fields are supplied as needed; these are noted in the table below.
| Accelerationᶜ | Extraᵉᵘʷ | Pore Pressureʷ | Stress-Strength Ratioᵐ |
| Conditionᵐ | Fluid Biot Modulus | Propertyᵖᵐ | Target Force Ratio |
| Convergence | Fluid Bulk Modulus | Saturation | Temperature |
| Densityᵐ | Fluid Densityᵐ | Strain Incrementʸ | Thermal Propertyᵖᵐ |
| Displacementᶜ | Fluid Propertyᵖ | Strain Rateʸ | Unbalanced Forceᶜ |
| Dynamic Timestep | Local Force Ratio | Stressᶻ | Velocityᶜ |
| Effective Stressᶻ | Multiplier |
| Key: |
| ᴸAll values provide a “Log” attribute |
| ᶜA “Component” attribute follows |
| ᵉAn “Extra” attribute follows |
| ᵐA “Method” attribute follows |
| ᵖA “Property” attribute follows |
| ᵘA “Type” attribute follows |
| ʷA “Source” attribute follows |
| ʸA “Quantity” and “Method” attribute follow |
| ᶻA “Quantity”, “Stress”, and “Method” attribute follow |
Log

Use a logarthmic scale.
Log: set (checked) a logarithmic scale on the \(y\)-axis.
Begin

Specify the starting point of the profile line.
Begin: set the \(x\), \(y\), \(z\) coordinate of the beginning point.
End

Specify the ending point of the profile line.
End: set the \(x\), \(y\), \(z\) coordinate of the ending point.
Points

Specify the number of points along the line for which values will be calculated. The default is 11.
Points: Set the number.
Chart Controls or Line Controls
In this position, a Chart Controls container will appear if “Chart” is selected in the Type attribute, or a Line Controls will appear if “Line” is selected.
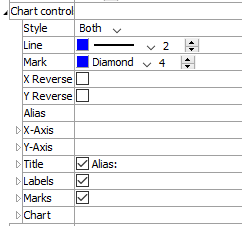
Chart Controls: a container that provides controls for adjusting the appearance of the profile chart.
Style: set profile line rendering to “Marks” (only), “Line” (only), or “Both”.
Line: set color, line style, and thickness of the profile line (hidden if “Marks” is selected for Style).
Mark: set color, shape, and size of marks used in the profile line (hidden if “Line” is selected for Style).
X Reverse: reverse the order of display of \(x\) values in the series.
Y Reverse: reverse the order of display of \(y\) values in the series.
Alias: Set the alias used to identify the profile series line in the legend.
X and Y Axis: these containers provide controls for the handling of the axes. Controls include “Log”, “Minimum”, “Maximum”, “Inside”, “Label”, and “Exponent”. See the description of these controls in the History Chart plot item for details.
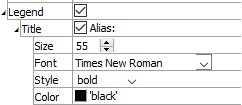
Title: set a title (checked) on the profile chart using the field adjacent to the checkbox to set the “Alias”. Additional controls are provided for size, text style, and font face used for the title.
Labels: include axis labels (checked), with additional controls for text size, font, and style.
Marks: include scale marks (checked) on the axes, with additional controls for text size, font, and style.
Chart: control chart appearance options, such as the “Border”, “Grid”, “Position” and “Size” of the chart.
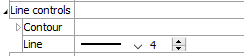
Line Controls: a container that provides controls over the appearance of the profile line.
Transparency
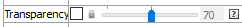
Set the transparency of the plot item. See the standard transparency control description for details.
Legend
Set item labeling in the plot legend. See the standard legend control description for details.
Beneath Title, the Profile plot item also provides a control in Legend for Series, when “Chart” is selected in the Type attribute.
| Was this helpful? ... | PFC 6.0 © 2019, Itasca | Updated: Nov 19, 2021 |