Plot Item Ranges
Range construction involves multiple steps. It is helpful to recognize that ranges and range construction resemble plotting in a few ways. Plots can be thought of as containers of plot items, where plot construction involves addition of one or more items to the plot. Ranges, similarly, are containers of range elements; range construction involves adding one or more elements to the range. This is done by selecting the “Range” item for a given plot item and pressing  and adding range elements from the ensuing dialog see (The Build Range Dialog).
A range applied to a plot item will show the portion of that plot item that lies within the range’s definition, while removing from view that which lies outside it. A range comprises one or more range elements. These elements are largely (though not completely) identical to the keywords that may be used with the range keyword — the overlap between the two should provide a sense of familiarity.

Add range elements to the range using the  on the toolbar to call the i Build Range dialog.
Show a range element (make it visible in the plot, if possible) by selecting it in the “Plot Item List.” It is removed from view when a different object is selected on the “Plot Item List.” Some range elements have no visual component and may only be edited by the “Attributes” section of the Plot Items control set.
Activate a range (turn on its filtering effect) or de-activate by toggling its  button.
Note
Showing and activating are independent of one another.
A range may be copied/pasted onto another plot item. This operation can be performed across plots.
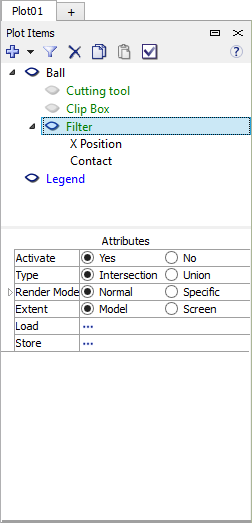
Edit the range of a plot item by selecting it or one of its range elements in the upper portion of the control set. The lower Attributes section of the control set (image above) will show its properties. These may be adjusted in the Attributes section of the control set, or, if a range element is selected and it has a visual component, it may be adjusted interactively by operating on the range element within the plot.
To manipulate the range without showing its effect on the plot item, de-activate it (toggle  ) but leave the “Range” item selected in the upper portion of the control set.
Range Attributes
Activate: This is equivalent to using the visibility toggle button (  ). Selecting “Yes” will cause the range to operate on the plot item; selecting “No” will leave the plot item unaffected. In either case, if one of the range’s range elements is selected, it will be shown in the plot if it is an interactive element. This means that while “No” is selected, a range element may be manipulated or its attributes may be changed, but effects will not be shown on the plot item.
Type: A range must be either the “Intersection” of its range elements or the “Union” of its range elements.
Render Mode: Select “Normal” to render the plot item normally while the range is active. In this state, the plot item is rendered according to its attributes. Selecting “Specific” will render the plot item in a range-specific way. In this state, various rendering attributes are available to modify how the plot item appears. One practical difference between the two is that during definition of the range, objects outside the range (and therefore to be removed by the range) are rendered transparently when the “Specific” mode is set; when “Normal” is set, they are removed immediately, as the range is being defined.
Extent: Determine whether range elements, when added, will have their default extents calculated from the current “Model” size or calculated according to the size of the current view on the “Screen.”
Load: Call a dialog that allows the user to load a stored Project Filter as the current range. The loaded Project Filter will replace the current range definition.
Save: Call a dialog that allows the user to save the current range definition as a Project Filter. Once saved, this may be used as either a range element (via the Saved Plot Filters element) or it may be “loaded” (per above) to make it the active range definition.
Ranges in the Plot Items Control Set

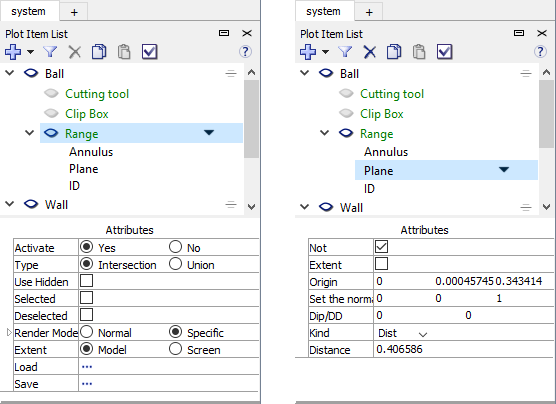
Figure 1: Ranges (left) and their range elements (right) have properties that are listed in the “Attributes” section below the “Plot Items List”.
Like plot items, when a given range or one of its range elements is selected in the upper portion of the i Plot Items control set, its editable properties are displayed and accessed from the lower “Attributes” portion of the set.
A range may be copied/pasted onto another plot item. This operation can be performed across plots.
Like plots, where the same item may be added multiple times to the plot, a range will accept multiple instances of the same range element (though it requires revisiting the “Build Range” dialog to add each instance).
The range sub-item cannot be deleted from a plot item. To clear a range on a plot item, delete its range elements by selecting it from the “Plot Items” list and pressing the  button on the toolbar.
Common Range Elements
The specific operations and attributes of each range element are described in the Range Element Index.
| Visual | Property-Based |
|---|---|
| Annulus | Component ID |
| Cylinder | Contact |
| DFN Distance | Extra |
| Ellipse | Extra List |
| Geometry Distance | FID |
| Geometry Int Count | FIDList |
| Plane | Fish |
| Polygon | Group |
| Position | ID |
| X Position | ID List |
| Y Position | Model Ranges |
| Z Position | Name |
| Rectangle | Radius |
| Sphere | Remove |
| Saved Plot Filters | |
| Set |
| Was this helpful? ... | PFC 6.0 © 2019, Itasca | Updated: Nov 19, 2021 |
