Stresses in a Jointed Medium
A spatial heterogeneity in an initial stress state can develop in a jointed and fractured medium. This results from the stress path followed during the geologic history of the medium, and the physical processes (related to fracturing and slip and separation along discontinuities) that may have occurred at different stages in the history. Spatial heterogeneity of the stress state can be an important factor in the design of underground excavations, particularly if the resulting stress concentrations adversely influence the excavation stability.
It is very difficult to determine whether the stress state installed in a jointed model is representative of the in-situ state of stress. A statistical analyses may provide a means to develop confidence in the model representation. One such study using UDEC is reported by Brady et al. (1986).
There are certain modeling aspects that should be considered when bringing a jointed model to an equilibrated state. First, the block insitu command should be invoked after all joints are generated in the model. Then the normal and shear stresses along joints will be initialized, corresponding to the initial stress values resolved along the plane of each joint.
As mentioned previously, a jointed model will not be in equilibrium initially, even when internal stresses are set to match boundary stresses: some calculation steps are required, and the unbalanced force should be monitored. In addition, histories of velocities or displacements should be recorded at various locations in the model. These are good indicators of the calculation step at which motion is negligible. The user should always ensure that motion in the model has essentially stopped for the equilibrium stress state before beginning the next stage of an analysis.
It is possible that, for the specified initial stress state and joint strength properties, some joints will slip or separate when the model is brought to an equilibrated state. Joint slip that is confined within the model is acceptable; “locked-in” stresses at the joint ends will result. However, the user should avoid conditions for which joint failure extends to the model boundary. This indicates that the model conditions are not well-posed. It may be necessary to reevaluate the assigned stress state, joint properties and joint orientations and locations. If conditions are such that joint failure still extends to a boundary, then a fixed boundary condition should be considered. This implies that the joint is truncated at the boundary.
The data file below demonstrates the case of a joint dipping at 60º, confined between two joints dipping at 20º. The 60º joint slips for the prescribed initial stress, while the 20º joints do not. The friction angle for all joints is 30º.
Slip of a confined joint
model new
model random 10000
model large-strain on

block create brick -10,10 -10,10 -20,0
;
block cut joint-set dip 60 dip-direction 90 origin 0,0,-10
block cut joint-set dip 20 dip-direction 90 origin 0,0,-8
block cut joint-set dip 20 dip-direction 90 origin 0,0,-12
block join on range pos-z -20,-14
block join on range pos-z -7,0
block zone generate edgelength 2.0
;
block zone cmodel assign elastic
block zone prop  dens 2000 bulk 8e9 shear 5e9

block contact jmodel assign mohr
block contact prop stiff-norm 5e11 stiff-shear 2.5e11 friction 30
block contact material-table default prop stiff-norm 5e11 stiff-shear 2.5e11 friction 30

block insitu stress -2.5e6,-2.5e6,-1e7  0,0,0
;
block face apply stress -2.5e6   0    0  0 0 0 range pos-x -10.0
block face apply stress -2.5e6   0    0  0 0 0 range pos-x  10.0
block face apply stress   0 -2.5e6    0  0 0 0 range pos-y -10.0
block face apply stress   0 -2.5e6    0  0 0 0 range pos-y  10.0
block face apply stress   0      0 -1e7  0 0 0 range pos-z   0.0
block gridpoint apply vel-z    0.0             range pos-z -20.0
;
model history mechanical unbalanced-maximum
block hist dis-z pos 0,0,-10
model cycle 1000
The figure below shows a block plot on which the region of joint slip is indicated by joint shear vectors. Contours of \(\sigma_{xz}\) are also plotted and show the areas of locked-in stresses near the ends of the 60º joint.
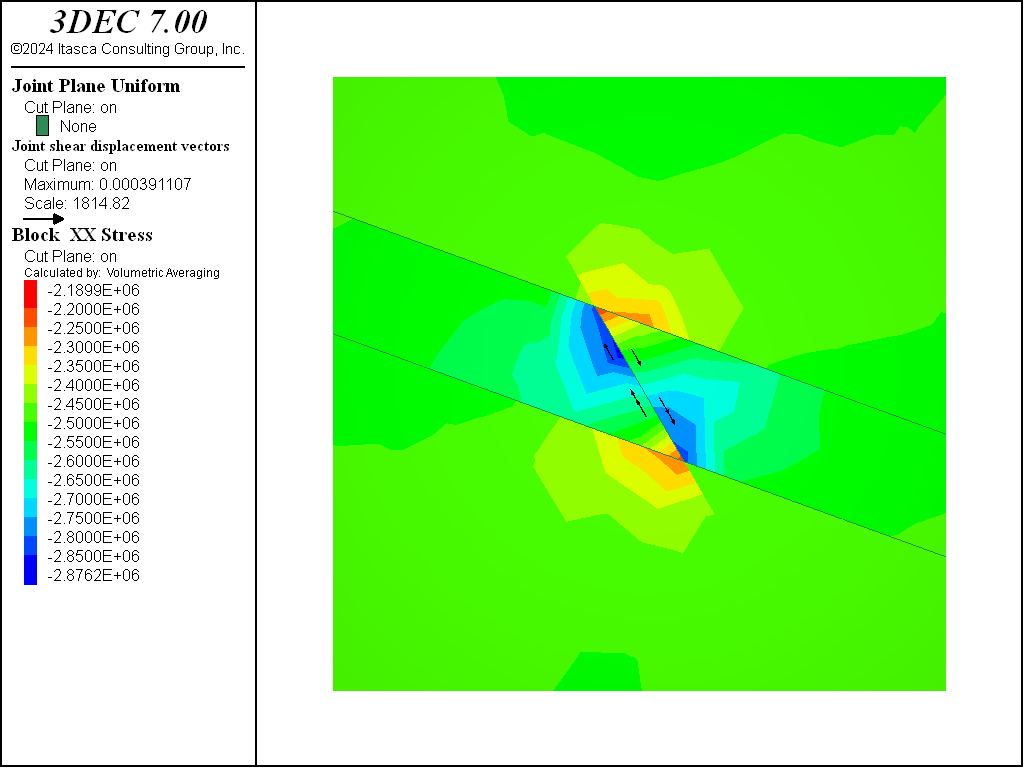
Figure 1: Slip of a confined joint; plot shows shear stress contours
| Was this helpful? ... | 3DEC © 2019, Itasca | Updated: Feb 25, 2024 |