IsoSurface Plot Item
Description
Zone value data as isosurfaces.
Attributes
Value followed by varying stuff IsoValue Color-By followed by varying stuff Color-List Polygons Cut-Line Hide-Null Map Def-fac Transparency Legend
Value

Select the zone value to display. Additional attribute fields are supplied as needed; these are noted in the table below.
Accelerationᶜ |
Extraᵉᵘʷ |
Pore Pressureʷ |
Strength-Stress Ratioᵐ |
Conditionᵐ |
Fluid Biot Modulus |
Propertyᵖᵐ |
Target Force Ratio |
Convergence |
Fluid Bulk Modulus |
Saturation |
Temperature |
Densityᵐ |
Fluid Densityᵐ |
Strain Incrementʸ |
Thermal Propertyᵖᵐ |
Displacementᶜ |
Fluid Propertyᵖ |
Strain Rateʸ |
Unbalanced Forceᶜ |
Dynamic Timestep |
Local Force Ratio |
Stressᶻ |
Velocityᶜ |
Effective Stressᶻ |
Multiplier |
Key: |
ᴸAll values provide a “Log” attribute |
ᶜA “Component” attribute follows |
ᵉAn “Extra” attribute follows |
ᵐA “Method” attribute follows |
ᵖA “Property” attribute follows |
ᵘA “Type” attribute follows |
ʷA “Source” attribute follows |
ʸA “Quantity” and “Method” attribute follow |
ᶻA “Quantity”, “Stress”, and “Method” attribute follow |
IsoValue

Do XXXX.
IsoValue: If “Auto” is checked, automatically calculate xxxx. If unchecked, manually specify xxxxxx. Press the “execute” button if changing the manual setting in order to regenerate the plot after the change is specified.
Color-By
Density |
Multiplier |
Extraᵉ |
Propertyᵖ |
Fluid Density |
Stateᵗ |
Fluid Propertyᵖ |
Thermal Propertyᵖ |
Groupˢ |
Type |
Model |
Uniform |
Key: |
ᵉAn “Extra” attribute follows |
ᵖA “Property” attribute follows |
ˢA “Slot” attribute follows |
ᵗA “State By” attribute follows |
Color-List

Set properties of the line used for the item color-list. See the standard color-list control description for details.
Polygons

Set properties of item facets. See the standard polygons control description for details.
Cut-Line
Set properties of the line used for the item cutline. See the standard cut-line control description for details.
Hide-Null
Do not show null items in the plot. See the standard hide-null control description for details.
Map
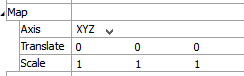
Map the item to new model coordinates. See the standard map control description for details.
Def-fac

Set the deformation factor. See the standard def-fac control description for details.
Transparency
Set the transparency of the plot item. See the standard transparency control description for details.
Legend
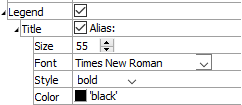
Set item labeling in the plot legend. See the standard legend control description for details.
Beneath Title, the isosurface plot item also provides controls in Legend for Count, Color-List, Map, and Def-Fac.
| Was this helpful? ... | Itasca Software © 2024, Itasca | Updated: Nov 12, 2025 |
