Plot Items in FLAC3D
Name |
Description |
|---|---|
Summary of current attach conditions. |
|
Beam information by label or value |
|
Model boundary information |
|
Cable information by label or value |
|
Zone Faces (all) |
|
Show the last-calculated factor of safety in the plot legend |
|
Geogrid information by label or value |
|
Gridpoint fixity conditions |
|
Location, value, or label information for interfaces |
|
Zone value data as isosurfaces |
|
Liner information by label or value |
|
Pile information by label or value |
|
Chart a grid attribute along a line defined in space |
|
Shell information by label or value |
|
Zone tensor data for stress or strain |
|
Paths of particles released into fluid flow field |
|
Vector data for a selected structural element type |
|
Vector data for a selected zone value |
|
Location of the water table used to calculate pore pressures |
|
Zone information by label or value |
|
Zone surfaces by group |
Visualizing FLAC3D Model Objects
For a number of model objects in FLAC3D, the principal determination in plotting is whether a label (group, extra variable, property, etc.) or a value (acceleration, force, velocity, etc.) of the item is to be shown. In the latter case there will be a scale involved in item coloration (a contour), such that the order of colors is meaningful. For a plot item where the label vs. value determination is decisive, the plot item attributes are set contextually in a top-down fashion: the setting of a given attribute above will determine which additional attributes appear below it. This behavior is usually confined to the first three to five attributes shown.
The “Descend from First Attribute” Pattern
When they appear, contextual attributes will flow in a specific order, descending from the first attribute (often “Color By” or “Type”).

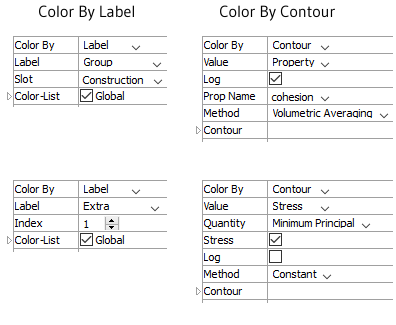
Figure 1: Four different colorations of a zone plot item. Note the attributes appearing between the second position and the final position vary, in each set, and are contextual to the Label/Value selected.
Color By appears first. It is used to selected whether a “Label” or a “Contour” is to be shown.
Label or Value appear next, as controlled by the setting of Color By. This attribute provides a selector that is used to specify which label or contour is to be shown.
Modifier fields are given next, as needed. Some labels or values selected will require further delineation* and, if so, attributes will appear dynamically in this position.
Color-List or Contour will appear last among the contextual controls. The standard controls for a color-list (when “Label” is selected) or a contour (when “Contour” is selected) are shown.
Note
*Examples (derived from the figure above, clockwise from top left) might include:
With “Label” chosen, “Group” is selected in the next attribute. In this case, an additional field for selecting which (or any) “Slot” is dynamically shown.
With “Contour” chosen, “Property” is selected in the next attribute. In this case, additional fields for “Log” (take the log base 10 of the value), “Prop Name” (which property is to be shown), and “Method” (of extrapolating values from zone centroids to gridpoints) are dynamically shown.
With “Contour” chosen, “Stress” is selected in the next attribute. In this case, additional controls for “Quantity” (which component of the stress tensor to show), “Stress” (whether to treat the tensor quantity as a stress value), and “Log” and “Method” (as previous) are dynamically shown.
With “Label” chosen, “Extra” is selected in the next attribute. In this case, an additional field for specifying the “Index” of the desired extra variable is dynamically shown.
| Was this helpful? ... | Itasca Software © 2024, Itasca | Updated: Nov 12, 2025 |
