Examples • Example Applications
Stresses around a Pressurized Concrete Tunnel (FLAC2D)
Problem Statement
Note
This project reproduces Example 7 from FLAC 8.1. The project file for this example is available to be viewed/run in FLAC2D.[1] The project’s main data files are shown at the end of this example.
This example demonstrates the stress analysis of a water tunnel that is excavated in rock, subsequently lined, and then pressurized. The analysis presented here considers the lining as a monolithic structure and includes gravitational loading of the surrounding rock mass.
The objectives of this analysis are to simulate stress relaxation in the rock after excavation and prior to liner installation, and to examine rock stresses after the lining is installed and the tunnel is pressurized.
The section to be analyzed is illustrated in Figure 1. The circular water tunnel has an excavated radius of 5 ft 10 in, and the monolithic liner is 10 in thick. The centerline location has been positioned, for convenience, at coordinate (0,0) and is located 30 ft below the ground surface. The water table is 5 ft below ground surface. The overburden is composed completely of a mica-schist rock with negligible amounts of decomposed rock and clay sediments over the top.
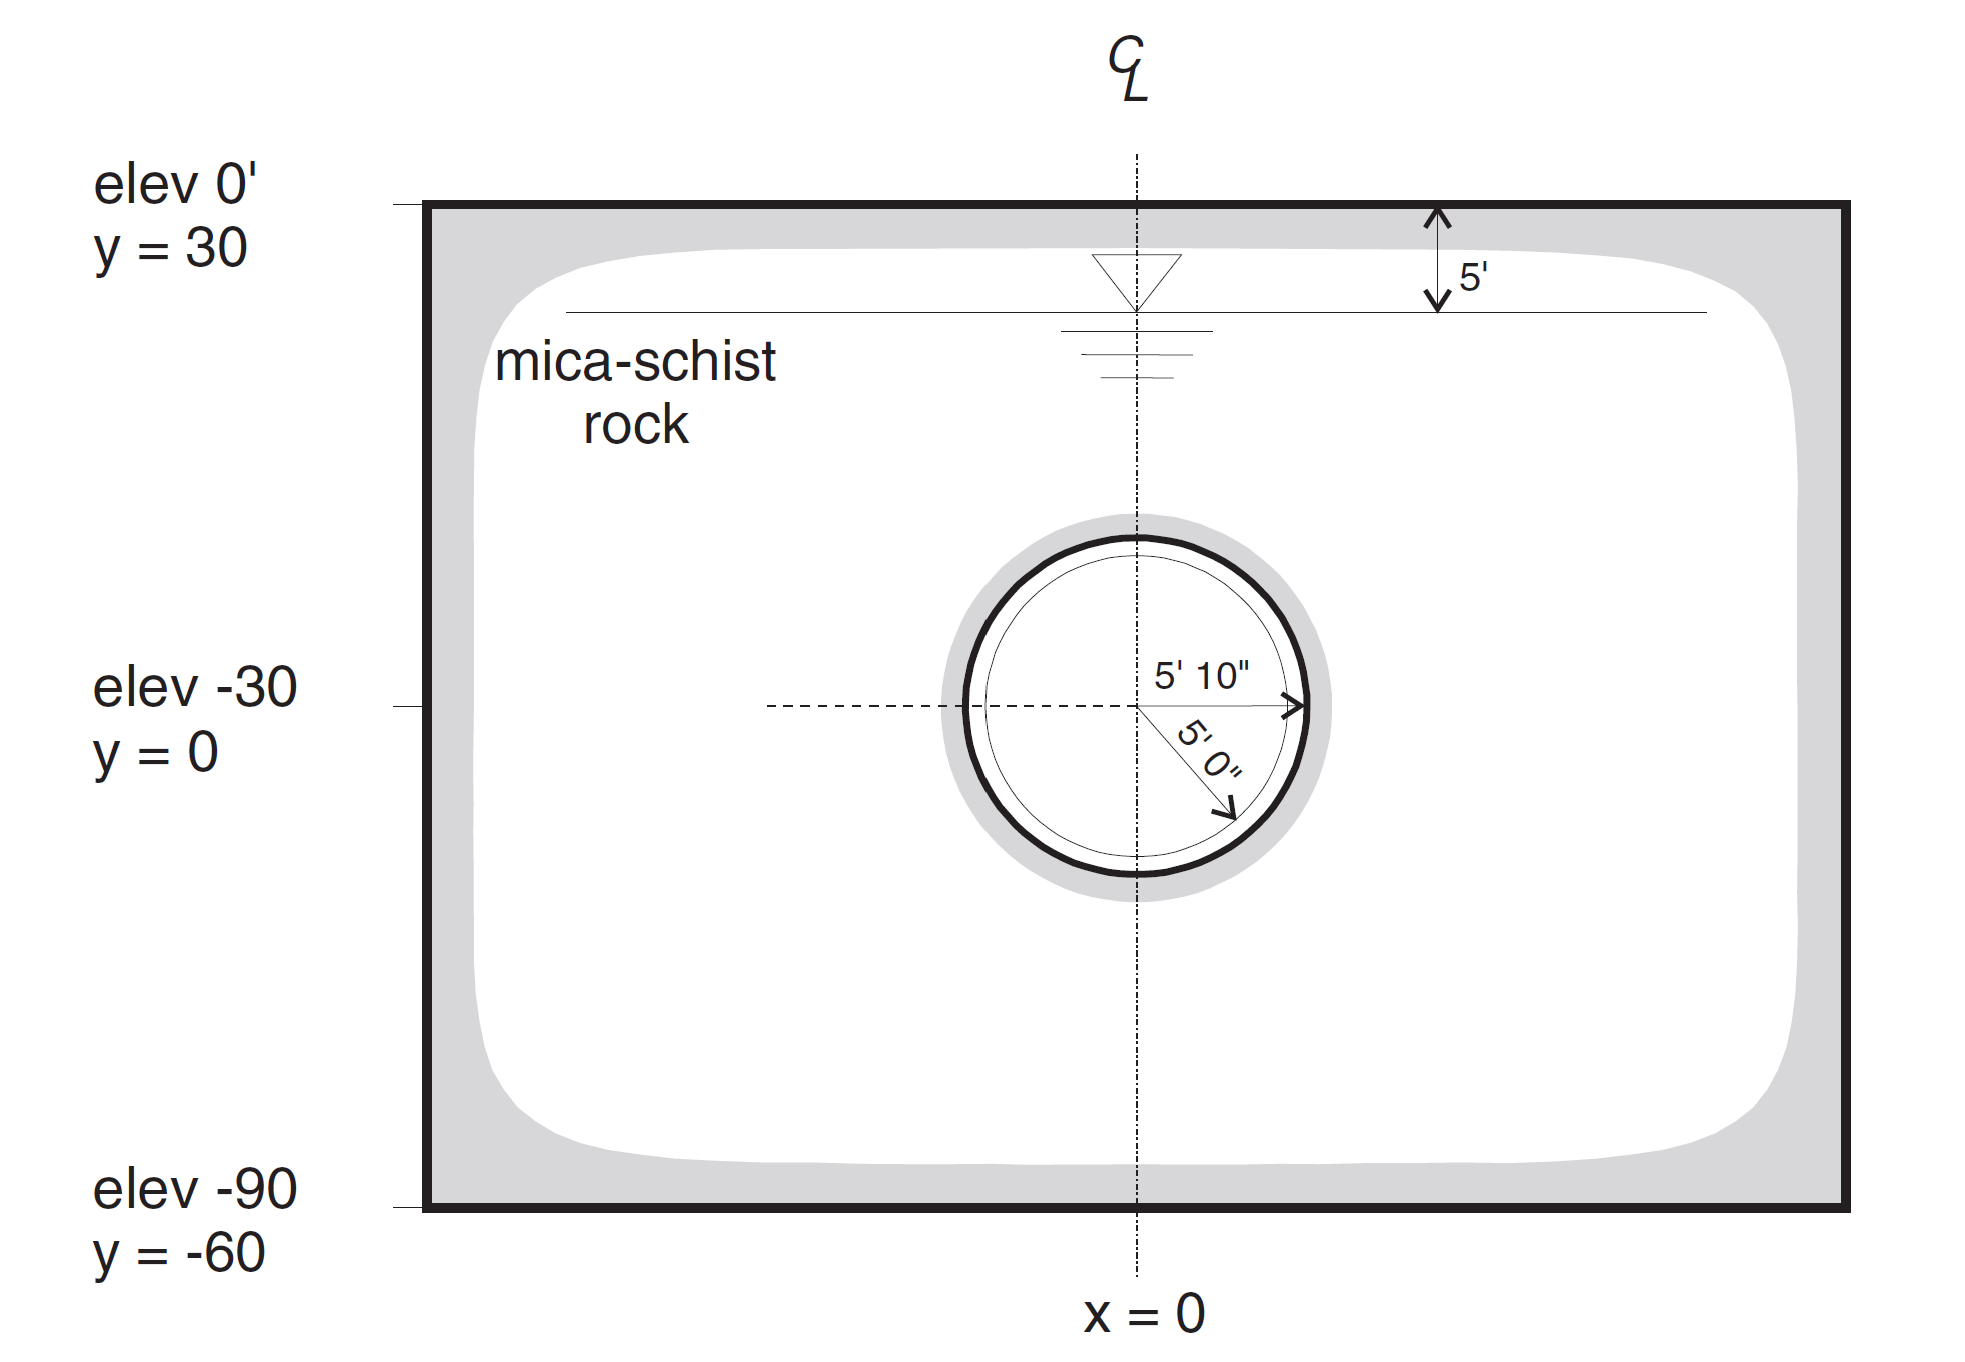
Figure 1: Geometry for water tunnel.
It is assumed that the rock is at equilibrium under gravity loading prior to making the excavation. Further, it is assumed that there is sufficient time delay between excavation and liner installation to permit the perturbed stress field to come to equilibrium.
The following properties describe the rock behavior.
dry unit weight |
151.3 pcf |
Elastic modulus (\(E\)) |
2 × 10⁶ psi |
Poisson’s ratio (\(\mu\)) |
0.32 |
Friction angle (\(\phi\)) |
45° |
Cohesion (\(c\)) |
30 psi |
Tensile strength (\(\sigma _t\)) |
30 psi |
For this study, the rock is assumed to be a homogeneous, isotropic material with no anisotropy (petrographic, bedding or jointing). The vertical in-situ stress is assumed to increase hydrostatically with depth as the sum of the water weight and the buoyant rock weight. The ratio of horizontal to vertical effective stress is 0.3. Depth stress gradients are assumed linear, with zero stress at the ground surface. Gravity is specified in the analysis.
Groundwater flow is neglected for this analysis. The unlined tunnel boundary is assumed to be impermeable, and change in pore pressure around the tunnel is assumed to only occur as a result of mechanical deformations. In order to evaluate the effect of the tunnel excavation on pore pressure change, two different effective-stress analyses are performed: one neglecting pore pressure change; and the other including mechanical generation of pore pressure.
The concrete liner is a continuous monolithic structure and is assumed to behave as a homogeneous, isotropic, linearly elastic material with elastic properties.
Elastic modulus (\(E\)) |
3.6 × 10⁶ psi |
Poisson’s ratio (\(\mu\)) |
0.2 |
The analysis focuses on the installation of a 1-foot section of the liner. In order to account for the plane-strain conditions assumed for the rock mass, the input value for \(E\) of the liner is divided by \((1-\mu ^2)\). The moment of inertia, \(I\) , for the lining is determined from \(I = t^3/12\), where \(t\) is the liner thickness.
After the liner is installed, the tunnel is pressurized to 200 psi. For this analysis, the pressurization is performed at the same stage during which the liner is installed.
Modeling Procedure
The basic assumptions that are applied for the FLAC2D analysis include the following.
The geometry of the tunnel is the same along the tunnel length, permitting the three-dimensional problem to be modeled in two dimensions as a plane-strain analysis.
The excavation face is advanced instantaneously and left unlined for sufficient time to permit the stress field to come to equilibrium. However, the time is not sufficient for flow of groundwater into the tunnel.
The liner is installed and pressurized instantaneously, permitting the stress field to respond to radial strain of the liner. The liner is also assumed to be rigidly connected to the rock, and acts as an impermeable barrier to groundwater.
Model Geometry
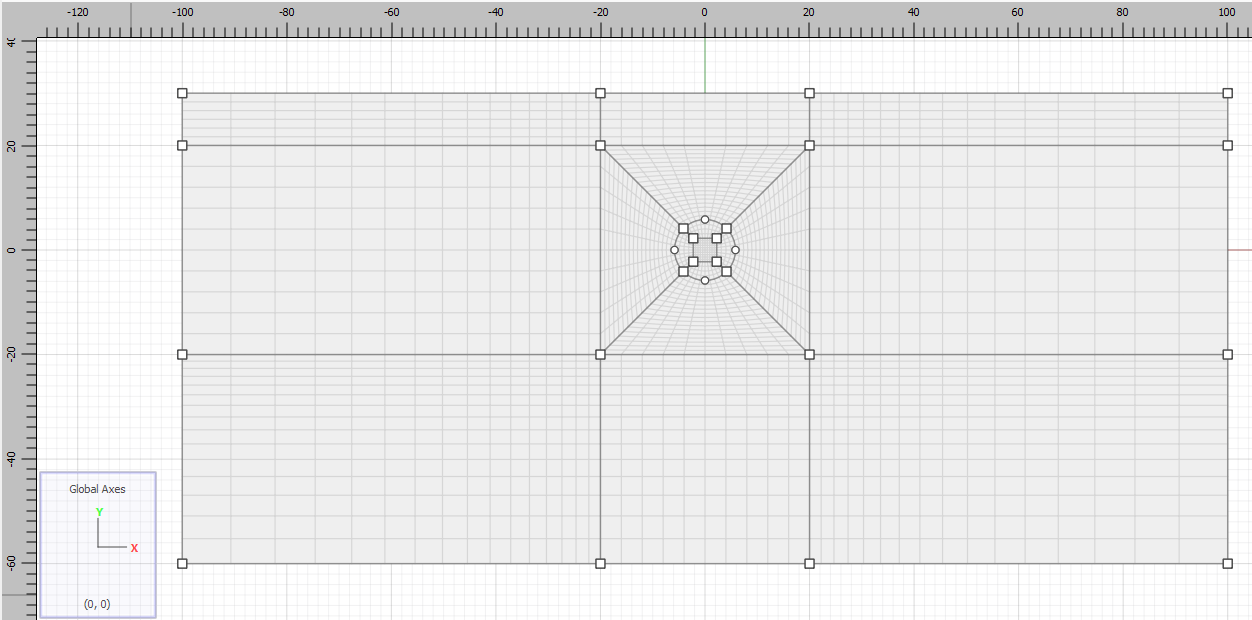
The tunnel model is built in Sketch by following these steps.
Use the tool and draw a box from -100,-60 to 100,30.
To make a structured mesh, draw the tunnel and divide it into 4-sided shapes. Select the , click the at -5,0 then 5,0. Now hold down Ctrl while clicking inside the tunnel at approximately 2,2. This will create the quadrilateral inside the tunnel with connections to the outer edge at 45° angles as shown below. If the Ctrl key is not used, the inside square will connect to the outer circle along the \(x\) and \(y\) axes, making it harder to create a structured mesh.
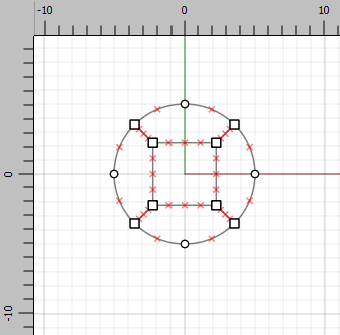
Now, the final tunnel size will have a radius of 5’10” (Figure 1). Since the nodes on the tunnel are now at 45° to the axes, set their coordinates to \(\left. \pm {5'10"} \middle/ {\sqrt{2}} \right.\) or \(\pm 4.12\). Click on each of the four nodes of the circle and change the coordinates accordingly.
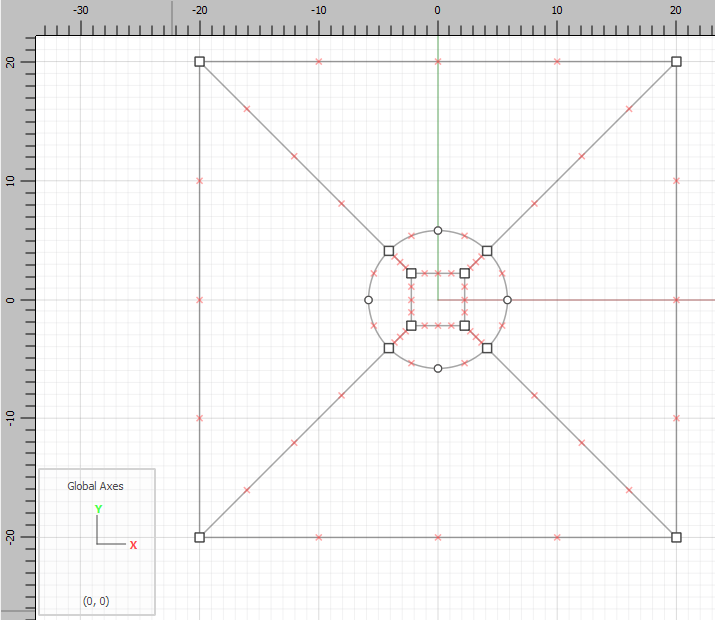
Draw another box from -20,-20 to 20,20.
Draw lines from the nodes on the tunnel to the corners of the box, as shown.
Note
In this example a structured mesh is created to match results from FLAC 8.1. The process for creating an unstructured mesh is much easier. Simply use the tunnel wizard to draw a circle with the desired radius and then mesh it.
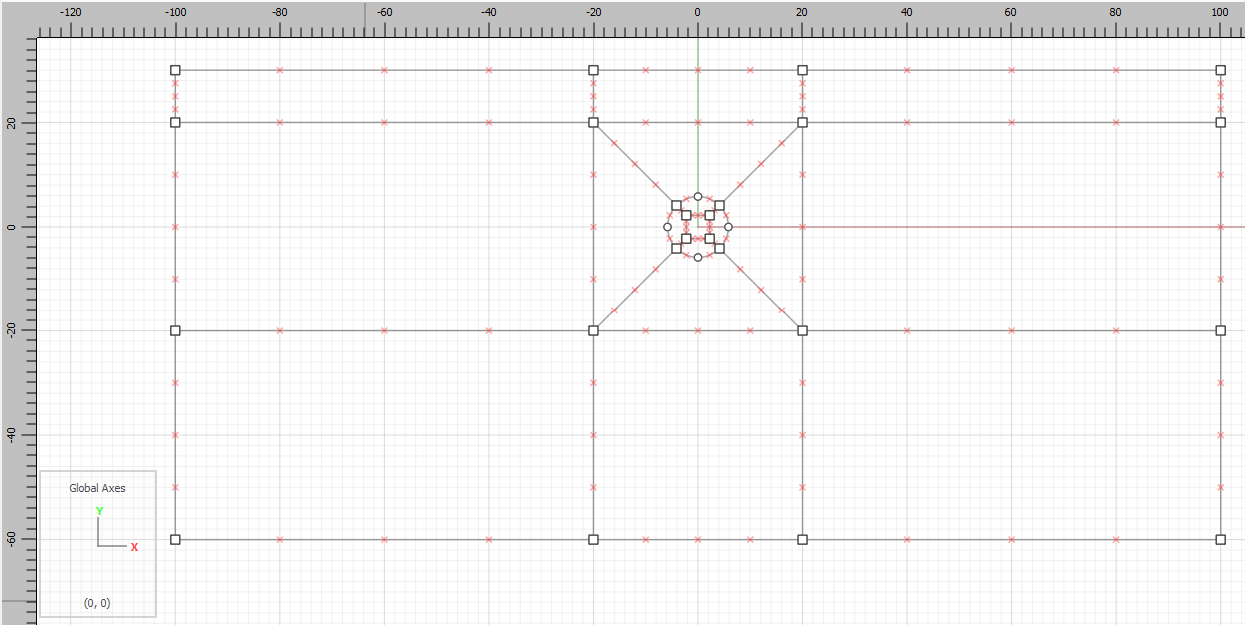
Draw horizontal and vertical lines from the corners of the small box to the edges of the big box.
Mesh all blocks.
Select one of the lines going from the edge of the tunnel to the corner of the surrounding box, and set the number of zones to 18.
Select one vertical edge of the surrounding box and set the number of zones to 10. Repeat for one of the horizontal edges.
Select the top-left vertical line (from -100,20 to -100,30) and set the number of zones to 6.
Select the bottom-left vertical line and set the number of zones to 15 and the ratio to 1.1.
Select the top-left horizontal line (from -100,30 to -20,30) and set the number of zones to 16, and then set the ratio to 1.1. You may have to Reverse the ratio on this lines and one or more horizontal lines below. The ratio direction depends on the way in which the lines are drawn.
Repeat the above step for the right side of the model.
Select the five blocks inside the circular tunnel. Set the group name to Tunnel.
Select the four curved edges that make up the outline of the circular tunnel. Set the group name to Tunnel Surface.
Generate the zones.
Save the project and the state. It is also a good idea to click on the State Record tab in the Commands area, right-click and export as a data file.
Modeling Procedure
The rest of the model run is done using commands as shown in the data files at the end of this document.
A Mohr-Coulomb constitutive model is assigned and properties are given as shown in Table 1. Roller boundaries are used to model zero x-displacement along the left and right boundaries. The bottom of the mesh is pinned in both the x- and y-directions.
The modeling sequence consists of three stages:
Stage I |
Establish equilibrium conditions to initialize stresses. |
Stage II |
Excavate water tunnel and allow stresses to come to equilibrium. |
Stage III |
Install tunnel lining, add pressure and cycle to equilibrium. |
Initial stresses are installed assuming a horizontal to vertical stress ratio of 0.3. The water table is wet at a height of 25 m. In this example, fluid flow calculations are not performed, the saturation is set manually to 0 above the water table.
The lining is represented by structural beam elements connected from node to node around the excavation. Beam elements are used to represent the liner because the beam is assumed to be perfectly bonded to the rock; therefore there is no need to specify liner-rock coupling properties. However, it is important to ensure the beam behaves as a plane-strain element by dividing its modulus by \(1-\nu^2\).
The internal tunnel pressure (200 psi) at the tunnel boundary is reduced to account for the thickness of the liner.
The effect of groundwater pressure on the liner is obtained automatically, because the total stress exerted by each rock zone contains a pore pressure component. As the liner deforms under load, it will affect the rock stresses and local pore pressures. The influence on pore pressures can be evaluated by the following approach.
Both effective stress analyses are run using model configure fluid mode. In the first analysis, pore pressures do not change; the water bulk modulus is set equal to zero.
In the second analysis, mechanical generation of pore pressures is included. A groundwater bulk modulus of 4 × 10⁷ psf is used in this case. model fluid active off is specified in order to exclude groundwater flow.
Both analyses are at a stress equilibrium state with the same total and effective stress distributions before the tunnel is excavated.
Results and Discussion
The results for the first case (no change in pore pressure) are plotted in a sequence of seven figures. Figure 6 shows effective stress (in psf) around the tunnel. It is seen that the major principal stress is vertical. As expected, these stresses increase with depth. The location of the water table is also shown.
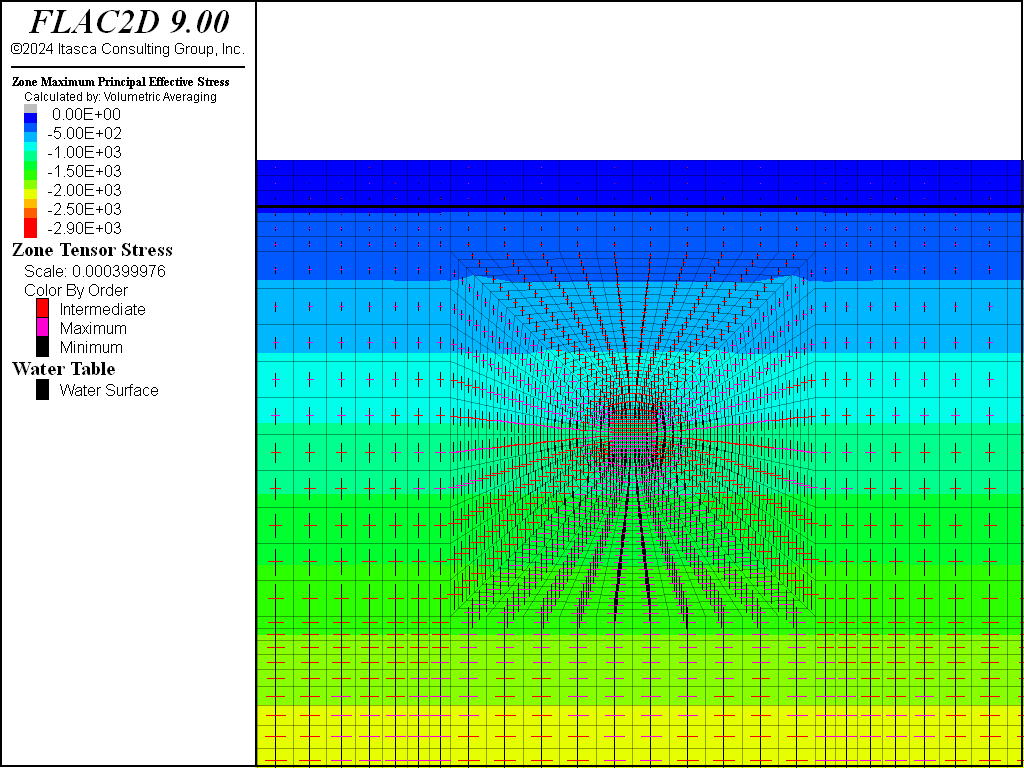
Figure 6: Effective principal stress distribution under gravity loading.
The next plot, Figure 7, is of the effective principal stresses after the excavation is made and stresses have come to equilibrium, but prior to liner installation. It is clear that the principal stress tensors rotate about the circumference of the excavation for a distance of about 1 tunnel diameter. Comparing the unexcavated to excavated stresses, it can be seen that the maximum principal stress has increased around the tunnel. However, the radial stresses are relaxed in the vicinity of the tunnel, and there is a tensile-stress region immediately surrounding the tunnel. Change in principal stress tensor direction between the unexcavated and excavated states represents shear stresses due to excavation.
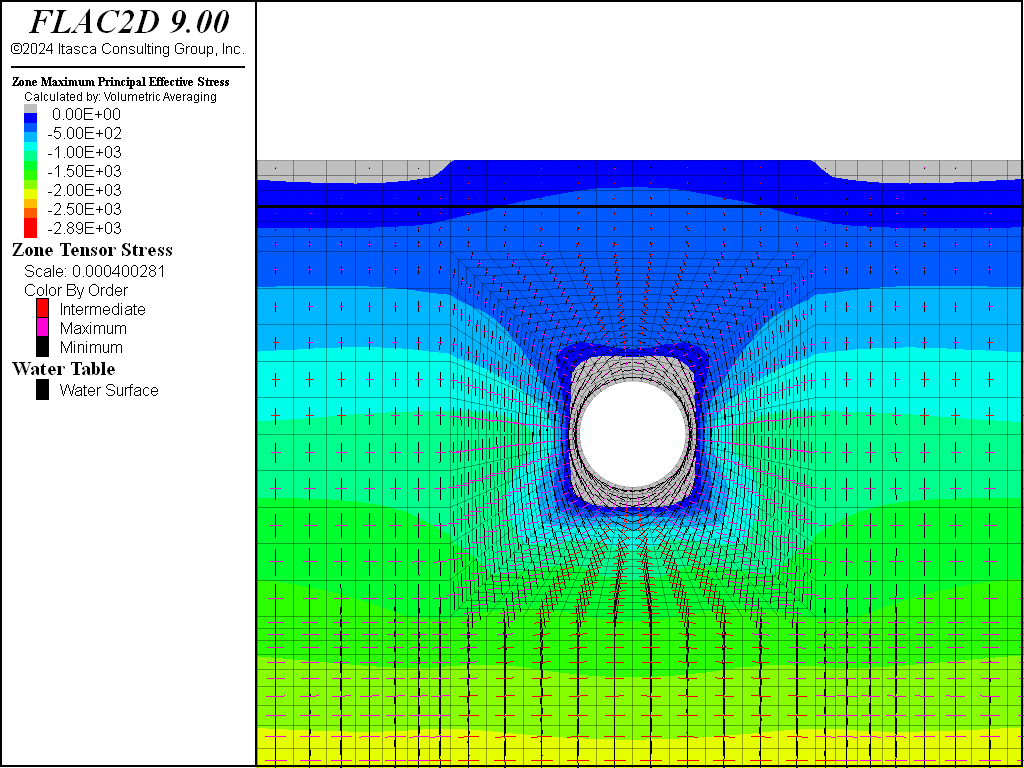
Figure 7: Effective principal stress distribution after tunnel excavation
Figure 8 and Figure 9 indicate the principal stress distribution after the lining is installed and pressurized and stresses have come to equilibrium. The tensile-stress region now extends farther away from the tunnel, all the way to the ground surface. The radial stresses surrounding the tunnel increase as a result of the pressurization, but the tangential stresses decrease and become tensile.
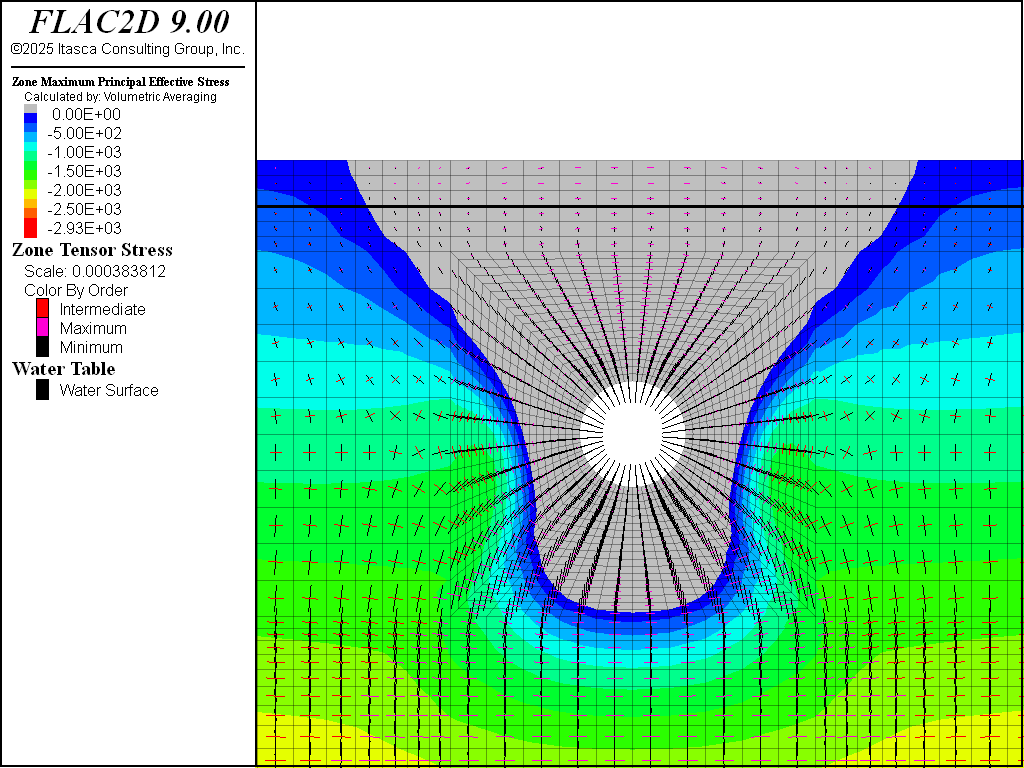
Figure 8: Effective principal stress distribution after tunnel excavation, liner installation and pressurization.
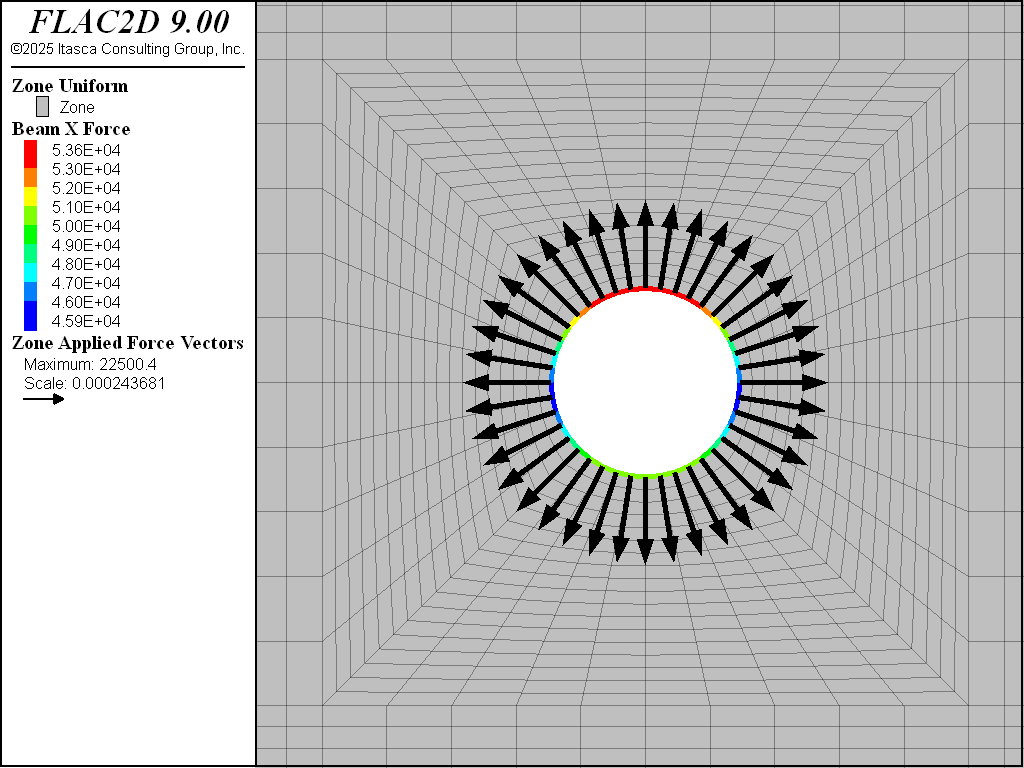
Figure 9: Close-up view of the axial forces in the liner and applied forces at tunnel boundary after liner installed and pressurized.
The plasticity plot in Figure 10 shows that many zones around the tunnel either are at yield, or were at yield in the past. However, none of the zones have failed yet in tension. The currently yielded zones are in the higher shear-stress regions.
Figure 11 plots the pore pressure distribution at the final state. Note that the pore pressures do not change for this analysis.
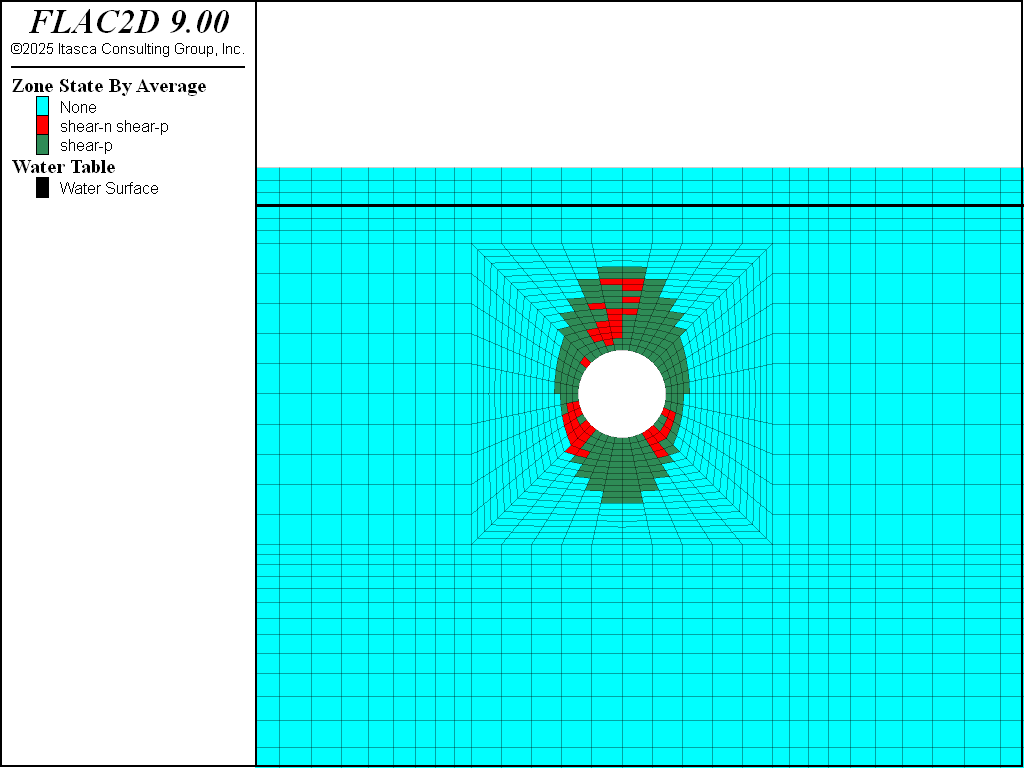
Figure 10: Plasticity indicators after liner installed and pressurized.
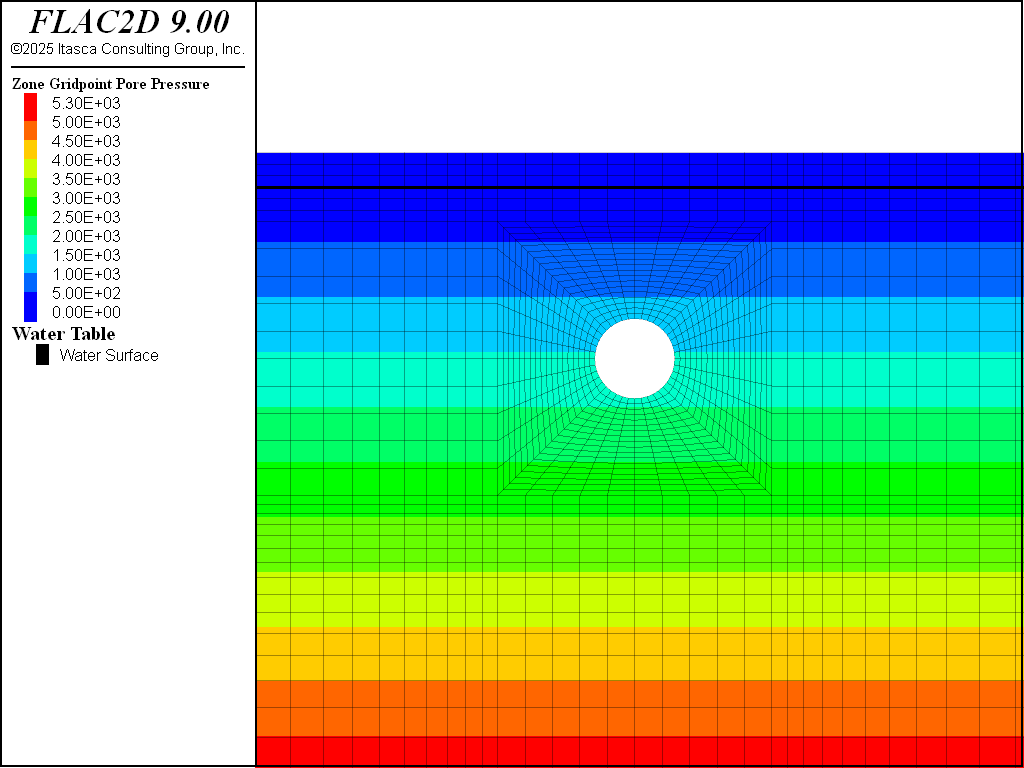
Figure 11: Pore pressure distribution after liner installed and pressurized (no mechanical generation of pore pressure).
For the second analysis, pore pressures can generate as a result of mechanical volume change during the tunnel construction stages. Pore pressure change is governed by the water bulk modulus. Figure 12 shows the pore pressure distribution after the tunnel excavation, and Figure 13 shows the distribution after the liner is installed and pressurized. These figures show that mechanical deformation has a noticeable effect on pore pressure.
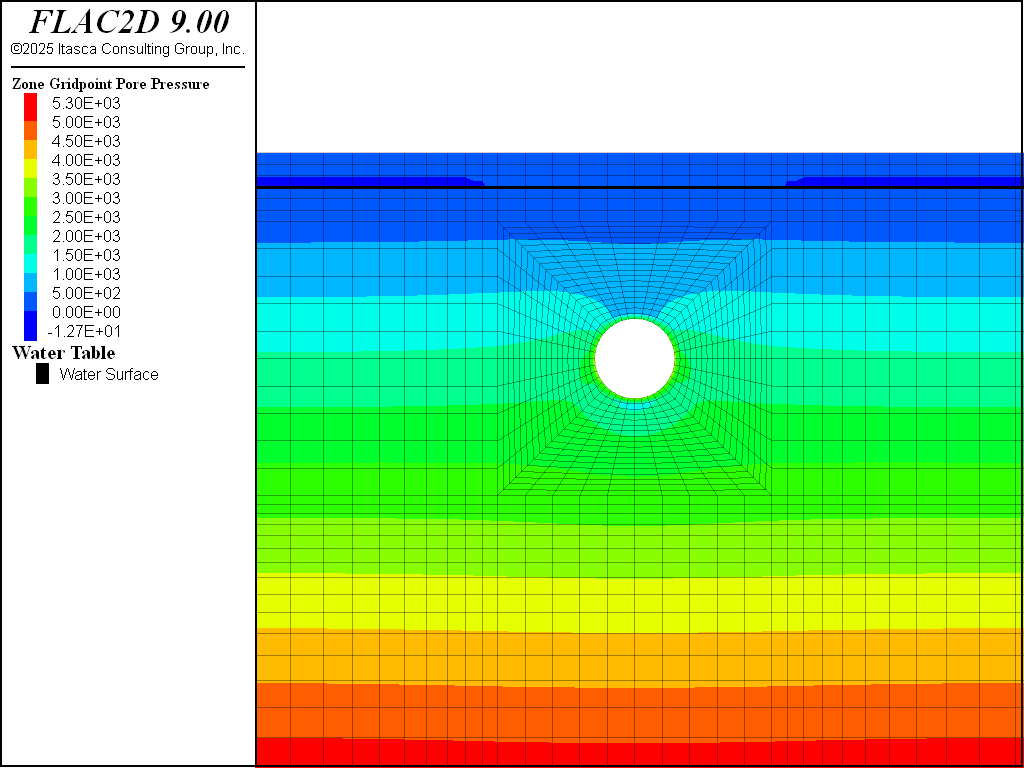
Figure 12: Pore pressure distribution after tunnel excavation (mechanical generation of pore pressure).
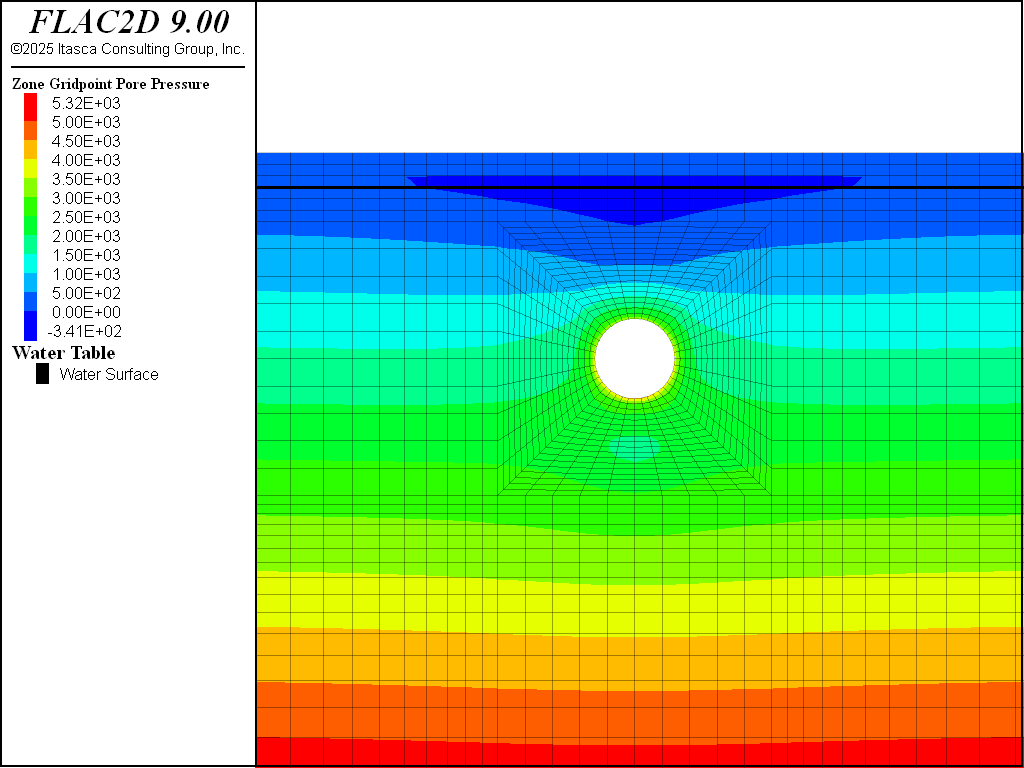
Figure 13: Pore pressure distribution after liner installed and pressurized (mechanical generation of pore pressure).
Figure 14 and Figure 15 show the principal stress distribution for the analysis, including mechanical generation of pore pressure. Although there was a noticeable change in pore pressure due to the undrained effect, the influence of change in pore pressure on the effective stress distribution and the extent of the tensile stress region is insignificant. Compare Figure 14 and Figure 15 to Figure 7 and Figure 8.

Figure 14: Effective principal stress distribution and tensile stress region after tunnel excavation (mechanical generation of pore pressure included).
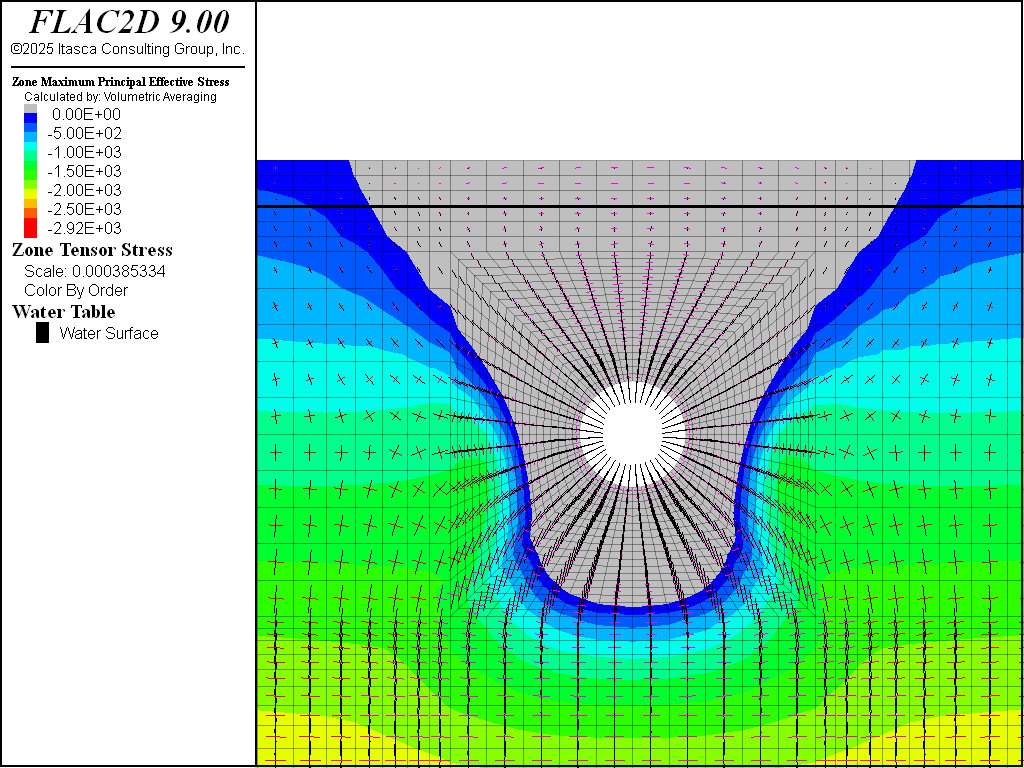
Figure 15: Effective principal stress distribution and tensile stress region after liner installed and pressurized (mechanical generation of pore pressure included).
Data Files
initial.dat
model new
model configure fluid

program call 'sketch'

; ====== mechanical properties =======
zone cmodel assign mohr-coulomb

; density is unit weight / gravity
zone property density [151.3/32.2]

; psi is converted to psf
zone property young [2e6*144] poisson 0.32 ...
  friction 45 cohesion [30*144] tension [30*144]

; ===== fluid properties ======
zone fluid cmodel assign isotropic
zone water density 1.938
zone fluid property porosity 0.3

; ===== boundary conditions =======
zone face skin
zone face apply velocity-x 0 range group 'East' or 'West'
zone face apply velocity 0 0 range group 'Bottom'

; ===== initial conditions =======
model gravity 32.2

; set pore pressure before installing stresses
; effective stress will then be used to calculate the horizontal stresses
zone water plane normal 0,-1 origin 0,25 effective

; zero saturation above the water table
zone gridpoint initialize saturation 0 range position-y 25.1 30.1

zone initialize-stresses ratio 0.3

; ===== solve ======
model fluid active off
model large-strain off

model solve elastic

model save 'initial'
no_fluid.dat
; model tunnel excavation and pressurization with no fluid effect
model restore 'initial'

; ==== delete tunnel =====
zone relax excavate range group 'Tunnel'
model solve
model save 'nofluid-1'

; zero displacements to see effect of pressurization
zone gridpoint initialize displacement 0 0

; ==== install liner =====

; make it a beam so we don't have to specify coupling props
; but be careful to adjust modulus to make it plane-strain
; also need to convert from psi
structure beam create by-zone-face range group 'Tunnel Surface'
structure beam property young=[3.6e6*144/(1.0-0.2^2)] poisson=0.20

; thickness is 10 inches.  Convert to feet
[thickness = 10.0/12.0]
structure beam property cross-sectional-area=[thickness] moi=[thickness^3/12]

; ====== apply pressure ======
; reduce pressure to account for thickness of liner (r1 / r2)
[factor = 5 / (5 + 10/12)]
zone face apply stress-normal [-200*144*factor] range group 'Tunnel Surface'

model solve

model save 'nofluid-2'
fluid.dat
; model tunnel excavation and pressurization with no fluid effect
model restore 'initial'

; ==== set fluid bulk modulus ====
zone gridpoint initialize fluid-modulus 4e7

; ==== delete tunnel =====
zone relax excavate range group 'Tunnel'
model solve
model save 'fluid-1'

; zero displacements to see effect of pressurization
zone gridpoint initialize displacement 0 0

; ==== install liner =====

; make it a beam so we don't have to specify coupling props
; but be careful to adjust modulus to make it plane-strain
; also need to convert from psi
structure beam create by-zone-face range group 'Tunnel Surface'
structure beam property young=[3.6e6*144/(1.0-0.2^2)] poisson=0.20

; thickness is 10 inches.  Convert to feet
[thickness = 10.0/12.0]
structure beam property cross-sectional-area=[thickness] moi=[thickness^3/12]

; ====== apply pressure ======
; reduce pressure to account for thickness of liner (r1 / r2)
[factor = 5 / (5 + 10/12)]
zone face apply stress-normal [-200*144*factor] range group 'Tunnel Surface'

model solve

model save 'fluid-2'
Endnote
| Was this helpful? ... | Itasca Software © 2024, Itasca | Updated: Nov 12, 2025 |
