Assessment of Fault Slip Potential from Sill Pillar Mining
Problem Statement
Note
The project file for this example may be viewed/run in FLAC3D.[1] The data files used are shown at the end of this example.
A 10-meter thick vertically dipping orebody is being mined by cut-and-fill methods at a depth of 950 to 1050 meters. Mining has taken place on two different levels, resulting in the formation of a sill pillar. The plan is to mine the sill pillar from the base up, in four cut-and-fill stages. Two vertical faults intersect the sill pillar, and it is necessary to determine the potential for slip on these features as mining of the sill pillar proceeds. Figure 1 shows the shape of the orebody in plan and long section, along with the locations of the faults, and the magnitude and the orientation of the in-situ stresses.
The properties of the ore, host rock and fill are outlined:
ore |
host rock |
backfill |
|
|---|---|---|---|
density (kg/m3) |
2700. |
2700. |
2000. |
bulk modulus (GPa) |
17.6 |
3.2 |
0.03 |
shear modulus (GPa) |
13.2 |
9.9 |
0.014 |
cohesion (MPa) |
10. |
8. |
0.05 |
friction angle (degrees) |
43. |
43. |
40. |
The properties of the faults are:
normal stiffness (N/m): |
1 × 10¹¹ |
shear stiffness (N/m): |
1 × 10¹¹ |
cohesion (MPa): |
0 |
friction angle (degrees): |
30 |

Figure 1: Diagram of the orebody, sill pillar, and faults.
Modeling Geometry
Sketch
It is assumed that the orebody and the faults are oriented vertically, so the model geometry can be created with Sketch to draw the top-down view and then extruding vertically. After opening a new Sketch set, follow these steps:
Draw a box from 880,900 to 1110,1130.
Create the sill pillar by drawing a polyline with points at the following coordinates. Because of the limited resolution of the grid, it may be necessary to click in approximately the right location and move the points afterwards (select them and change the Position in the Object Properties):
950,1000
950,1010
996,1010
1028,1042
1035,1035
1000,1000
Close the polyline by clicking on the first point again.
Draw one fault as a line from 1075,900 to 880,1100.
Draw the second fault from 1017.5,900 to 1017.5,1130. When starting to draw the line, press spacebar to enter the coordinates of the first point. Then draw the vertical line by holding down Ctrl while drawing the line. Extend past the top of the model and then delete the unwanted point. The model should appear as shown below.
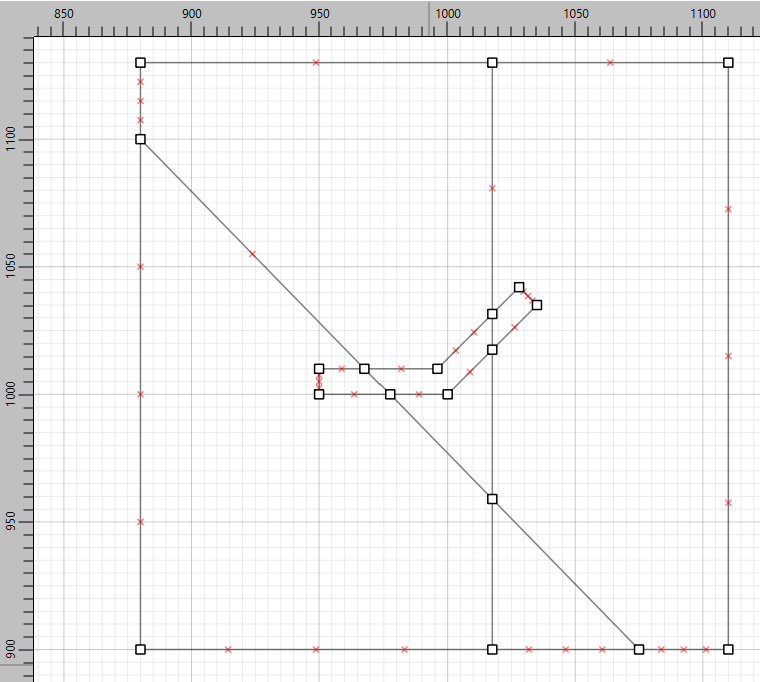
Figure 2: Plan view of model drawn in Sketch.
Smaller zones around the pillar are desired, so now a box is drawn to be used to define the high-resolution region later. Draw a box from 930,980 to 1050,1060.
In the meshing menu under
Auto-size...set the zone length to 10 in the whole model.Select all of the edges in the inner box (including the box itself) and set the zone length to 5 in the Object Properties.
In the meshing menu under
Set meshing parameters..., check the box to create unstructured meshes only, and click the button toMesh Now.
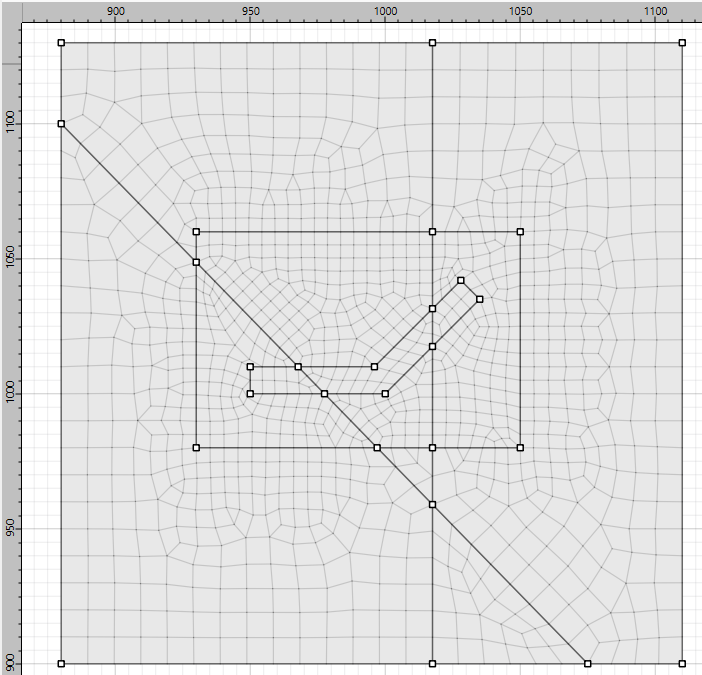
Figure 3: Zoning for the model.
Now assign groups. Select all of the polygons (first click inside of a polygon and then use Ctrl-A). Set the group to
rockin slotgeology.Select the three polygons that define the pillar and set the group to
orebodyin slotgeology.
Note
The faults must have different group names for the zone separation logic to work.
Select the six segments of the angled fault and set the group name to
fault 1and the slot tofaults.Select the six segments of the vertical fault and set the group name to
fault 2in slot tofaults.
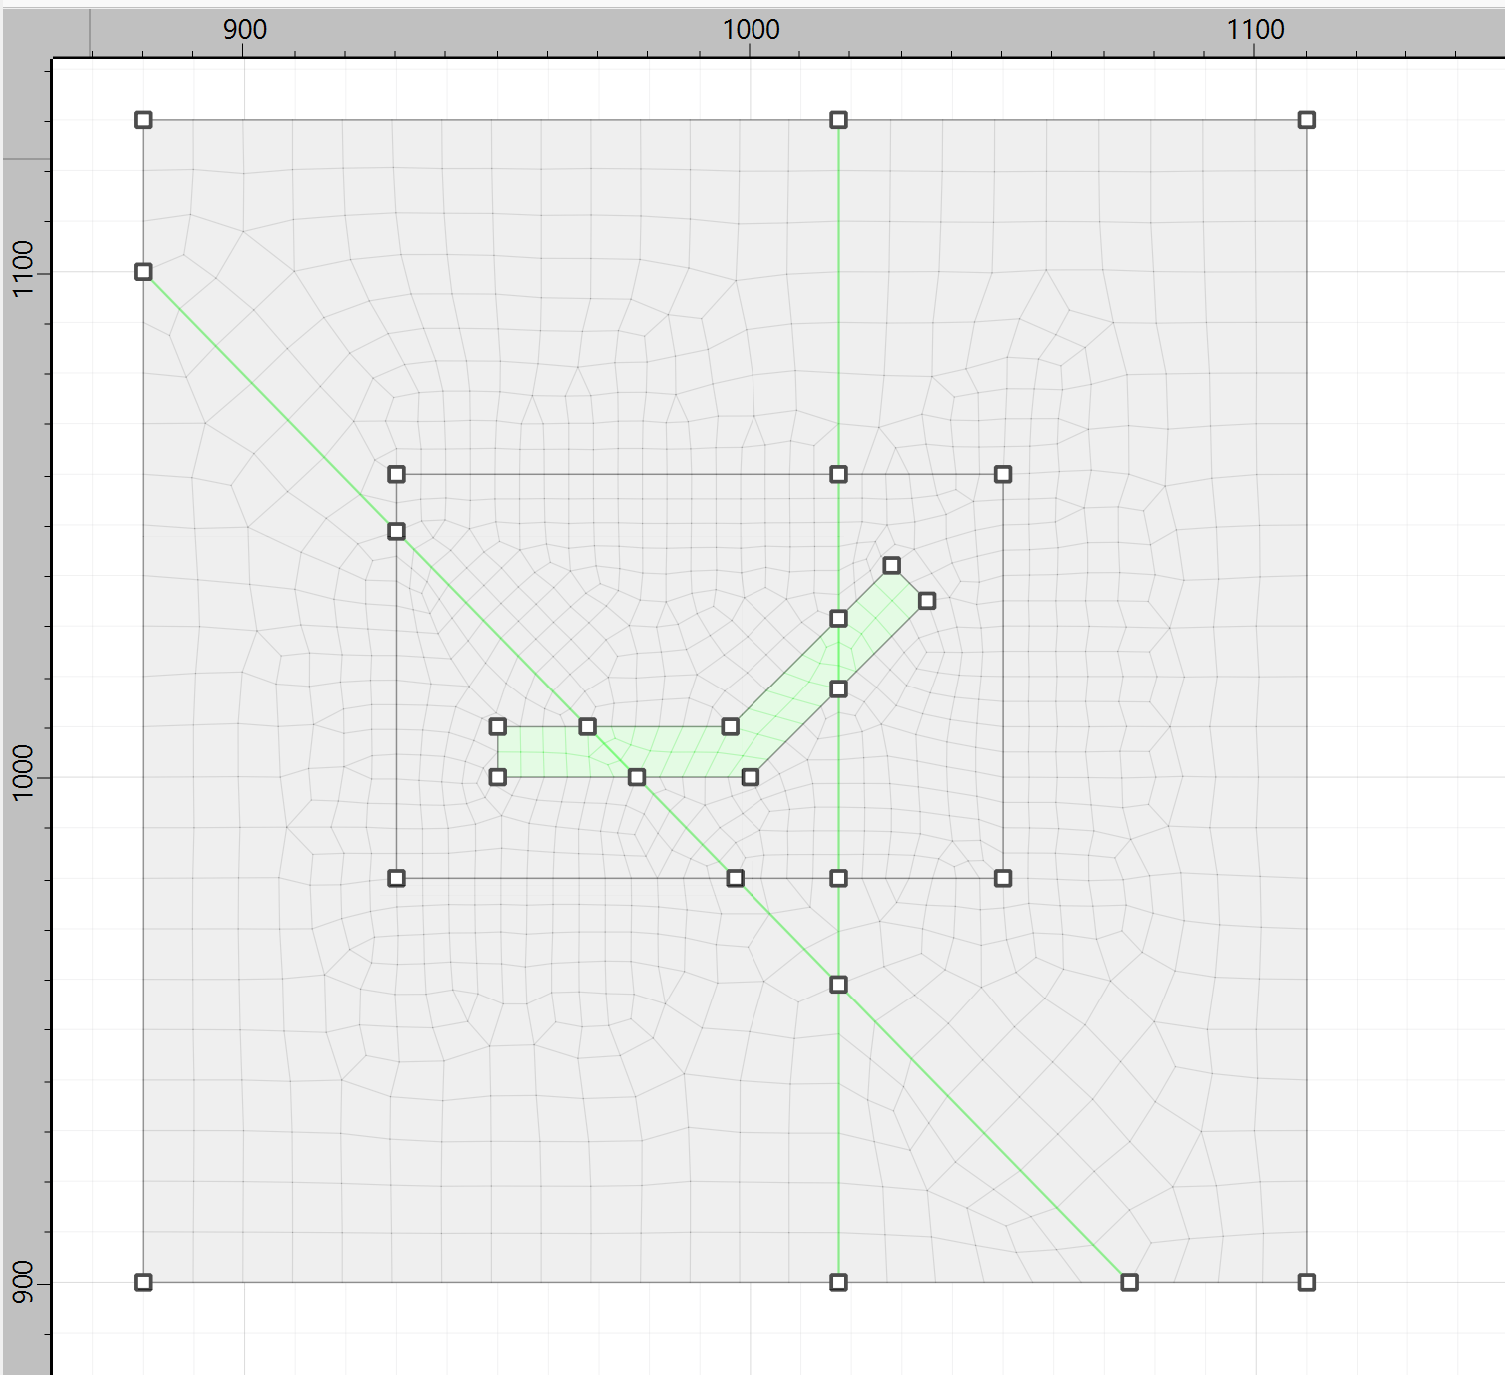
Figure 4: Groups for the model shown in green.
Now extrude the model. Select the Side View. First, change the default extrusion direction and the starting \(z\)-coordinate. Click the Global Axes in the bottom left. In the Object Properties, set the
Extr. Originto 0,0,4110 and set theExtr. Axisto-Z. (Note that the coordinates are relative to what is set in the Front View, so leave \(x\) and \(y\) as 0).Click on the point on the right of the model. The Position should read 230,1015. The first coordinate is the relative position from the origin in the direction of extrusion. Change the first coordinate from 230 to 60.
Draw a horizontal polyline starting at the right point and adding points at the following horizontal coordinates:
110
115
120
125
130
160
220
In the meshing menu, select
Auto-size...and set the zone size for all segments to 10.Select the second line segment (60 to 110) and set the zone size to 5 in the Object Properties.
Do the same for the penultimate line segment (130 to 160).
Create the zones. The model should now appear in the Model workspace as below. Save the model state and the project.
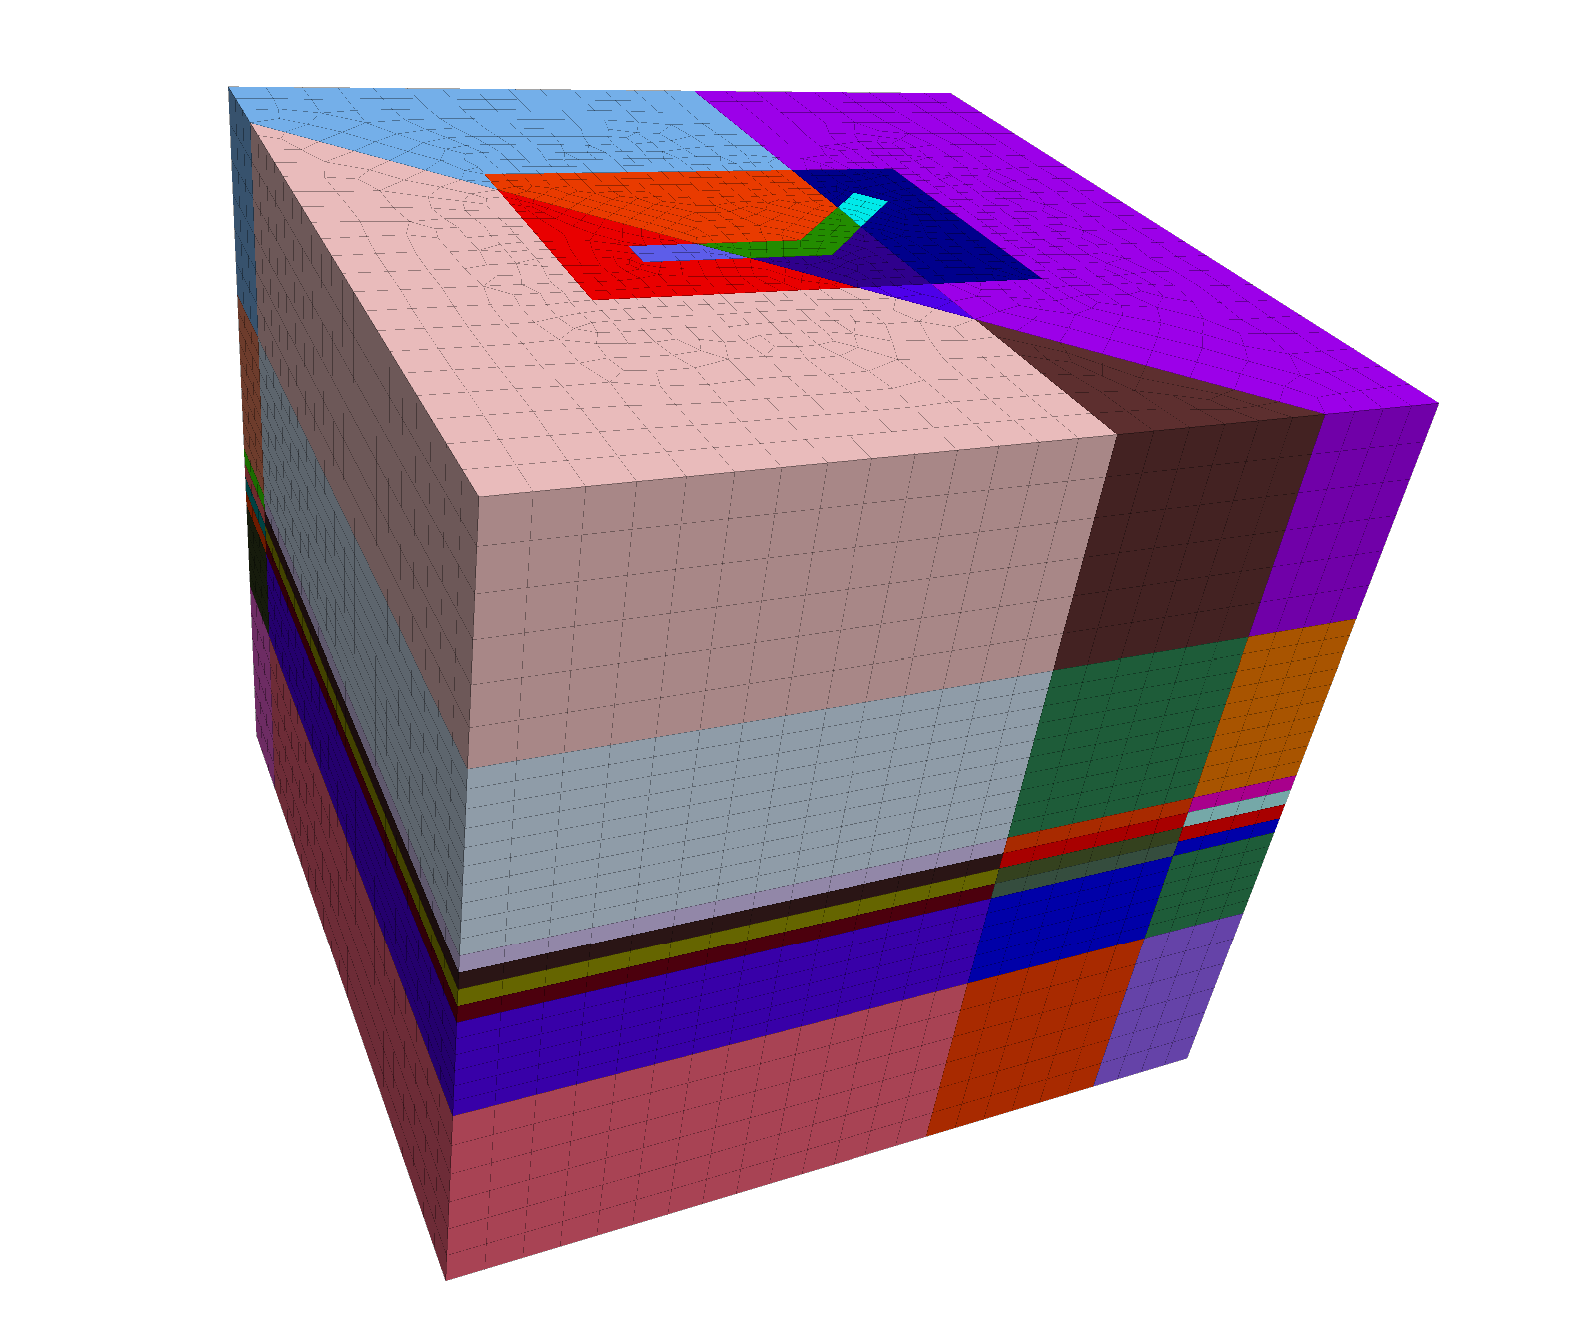
Figure 5: Extruded model.
Model Workspace
After extrusion, the orebody extends through the whole model. It is assumed that the top and bottom portions are not part of the orebody. Change the group slot being displayed to Segment. Select the top segment (1) and the bottom segment (8). Set their group name to rock in slot geology. (Both of these should be available in the drop down menus in the Group Assignment dialog.)
Note
It is a good idea to automatically assign face groups before densifying because if densification is done first, group names are assigned to the boundaries between the densified and undensified regions, making the model more complicated than it needs to be.
For the model, it will be desirable to densify zones in the area of interest. Before doing so, however, set the group names for faces on the surface to make it easy to apply boundary conditions later. Click the button to Assign group names to faces automatically. Check the box to ignore existing group names. Face groups should be automatically assigned as below.
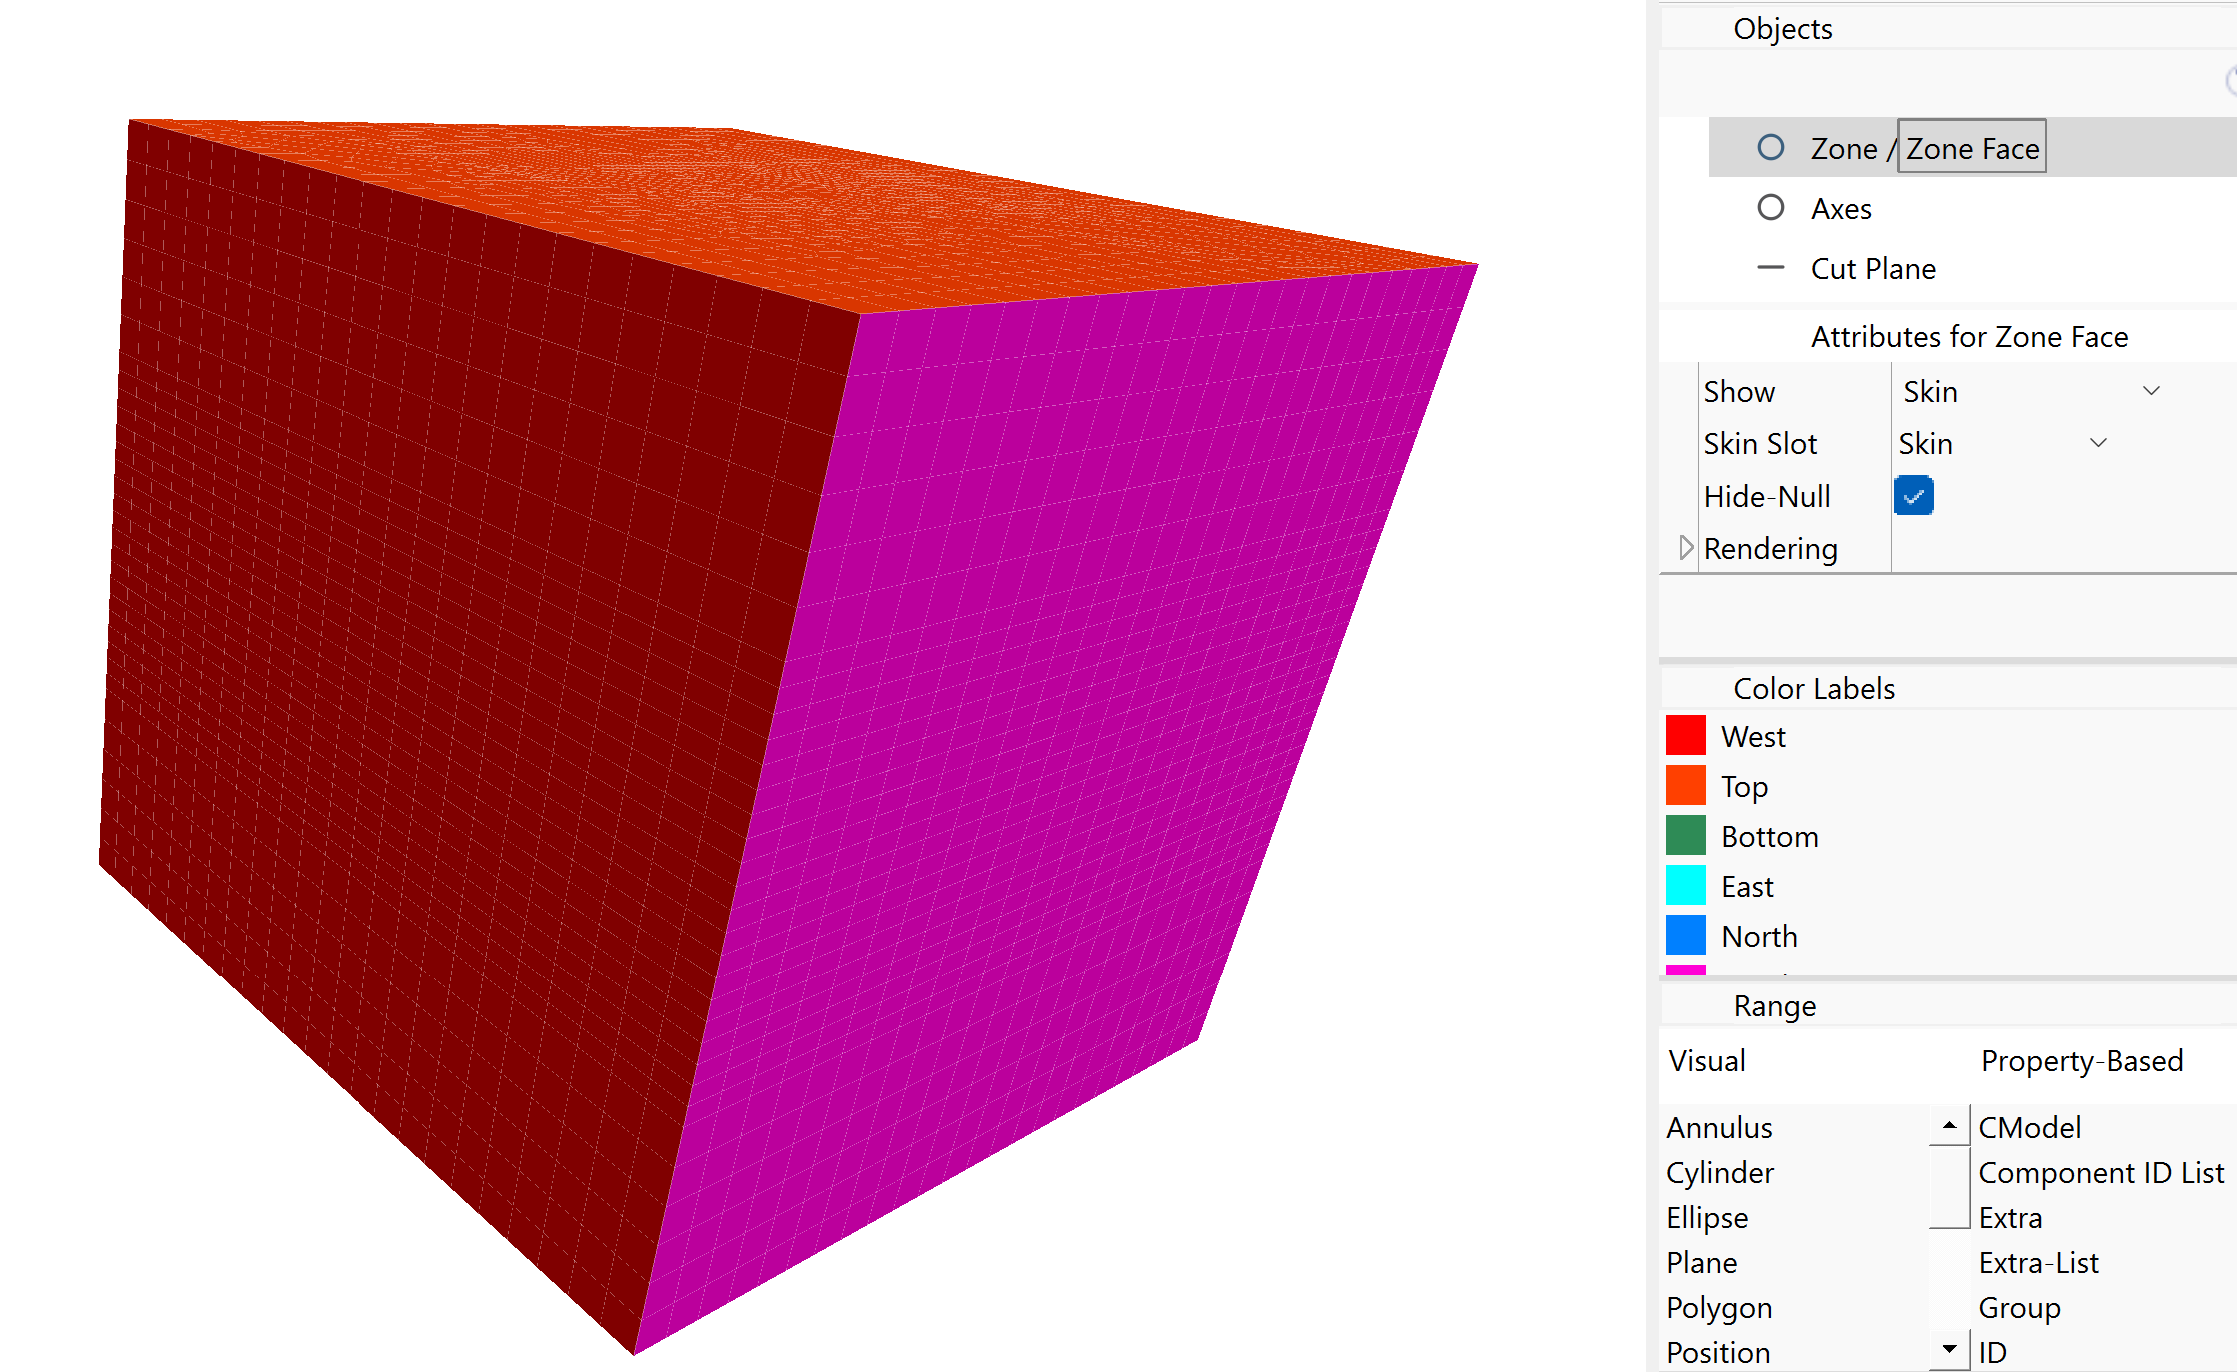
Figure 6: Automatically assigned face groups in the model.
Now densify the zones in the region of interest. Change the view to show Zones instead of Zone Faces. The groups should still be showing the Segment slot with the top and bottom segments selected. Hide these segments.
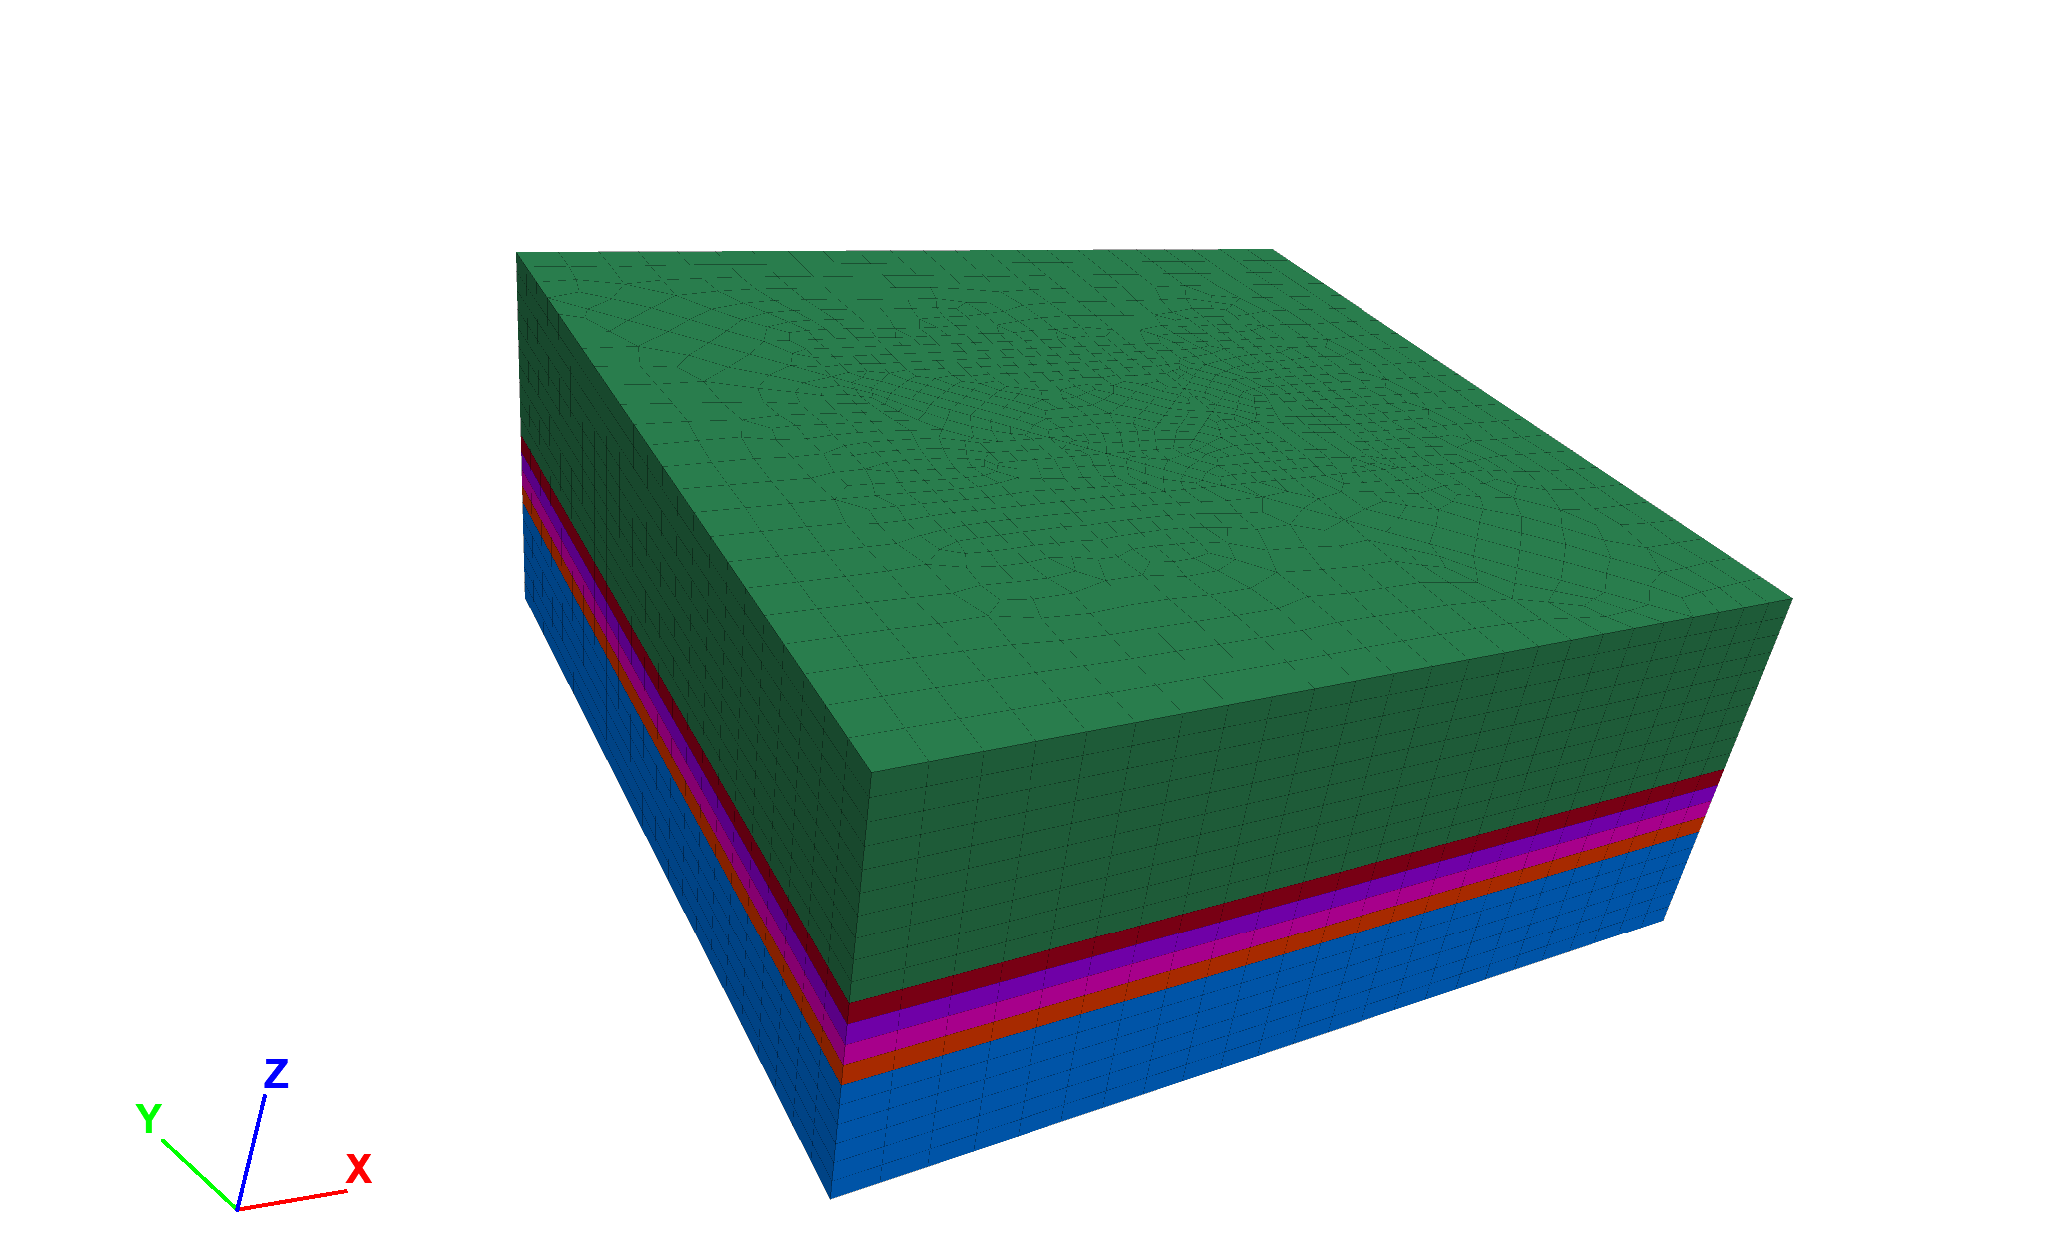
Figure 7: Model with top and bottom segments hidden.
Next, change the slot to Block. Select and hide the blocks outside the area of interest.
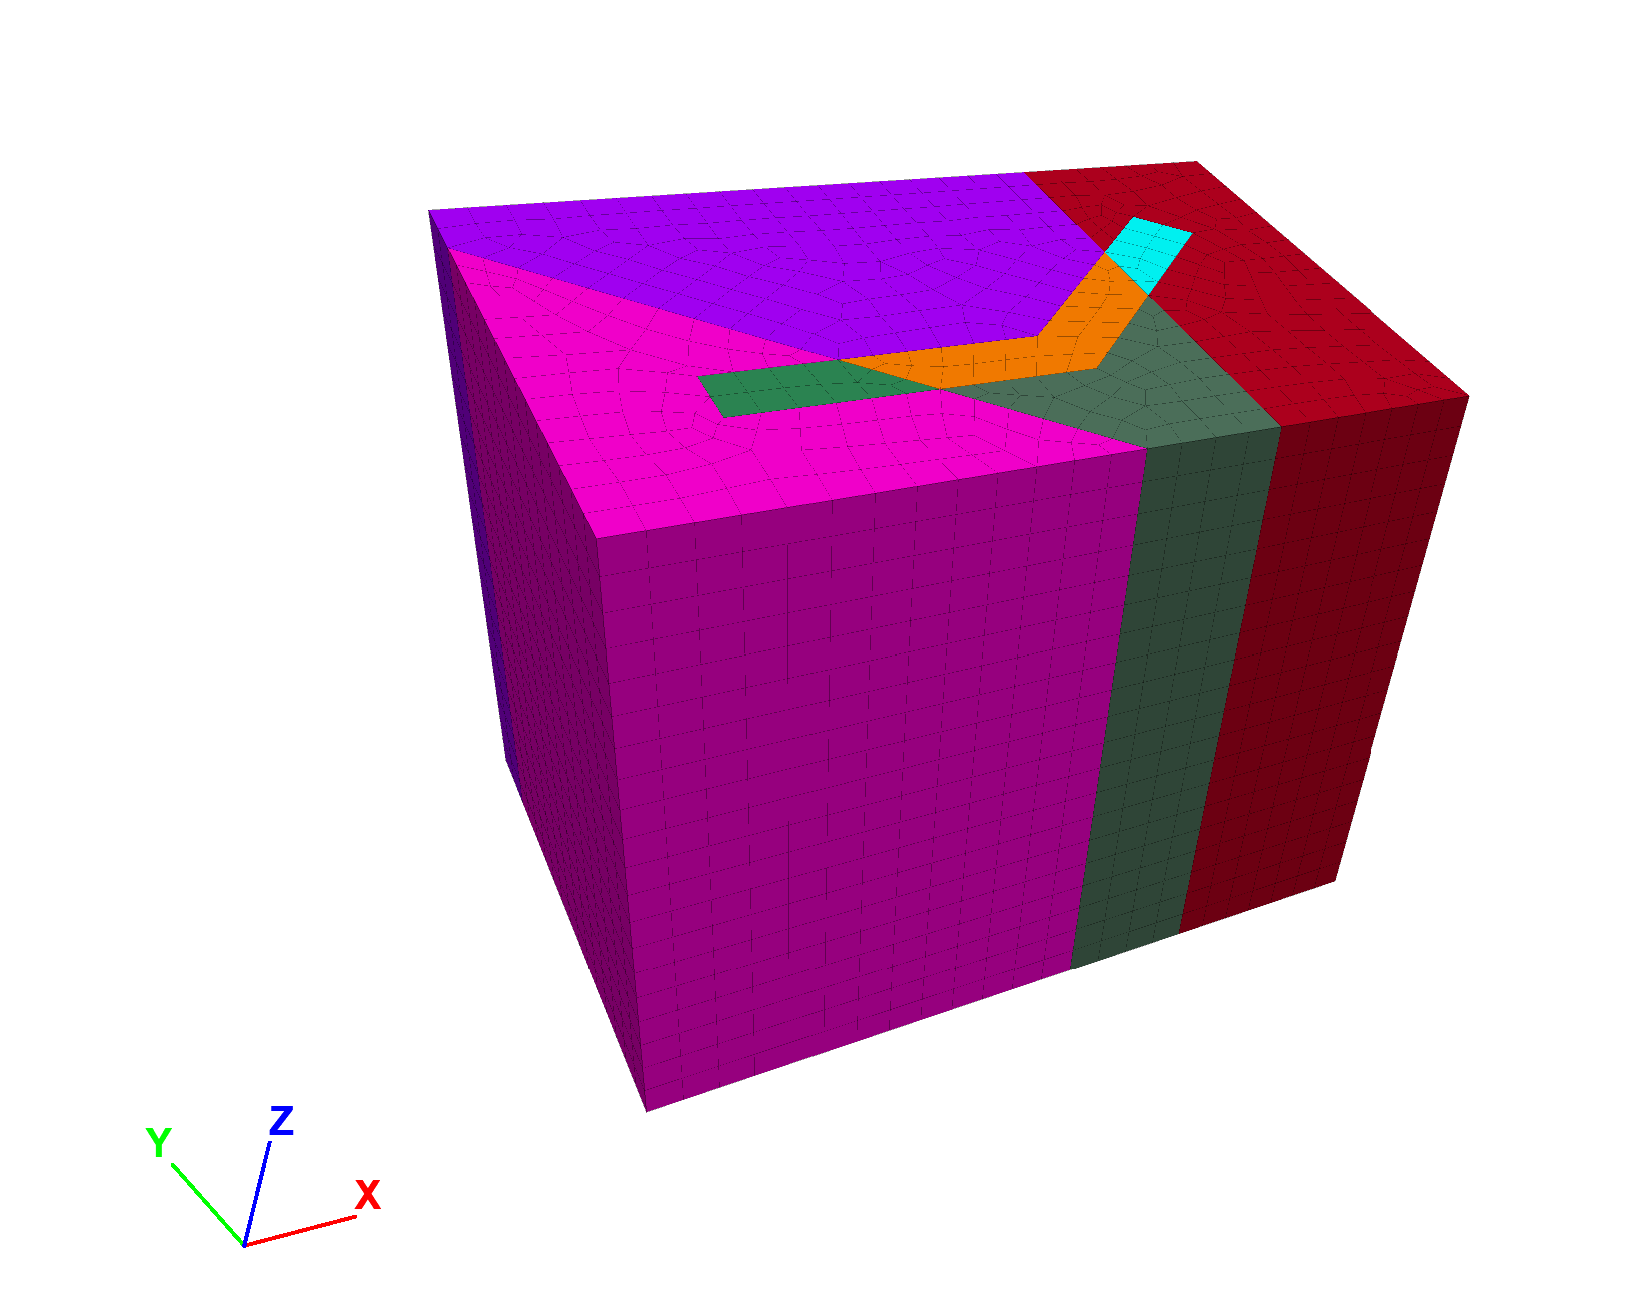
Figure 8: Model with blocks hidden outside the area of interest.
Now select all visible blocks (Ctrl-A) and choose Densify the selected zones from the drop-down menu at the top right of the Model workspace toolbar. Set the number of segments to be two in each direction (the default).
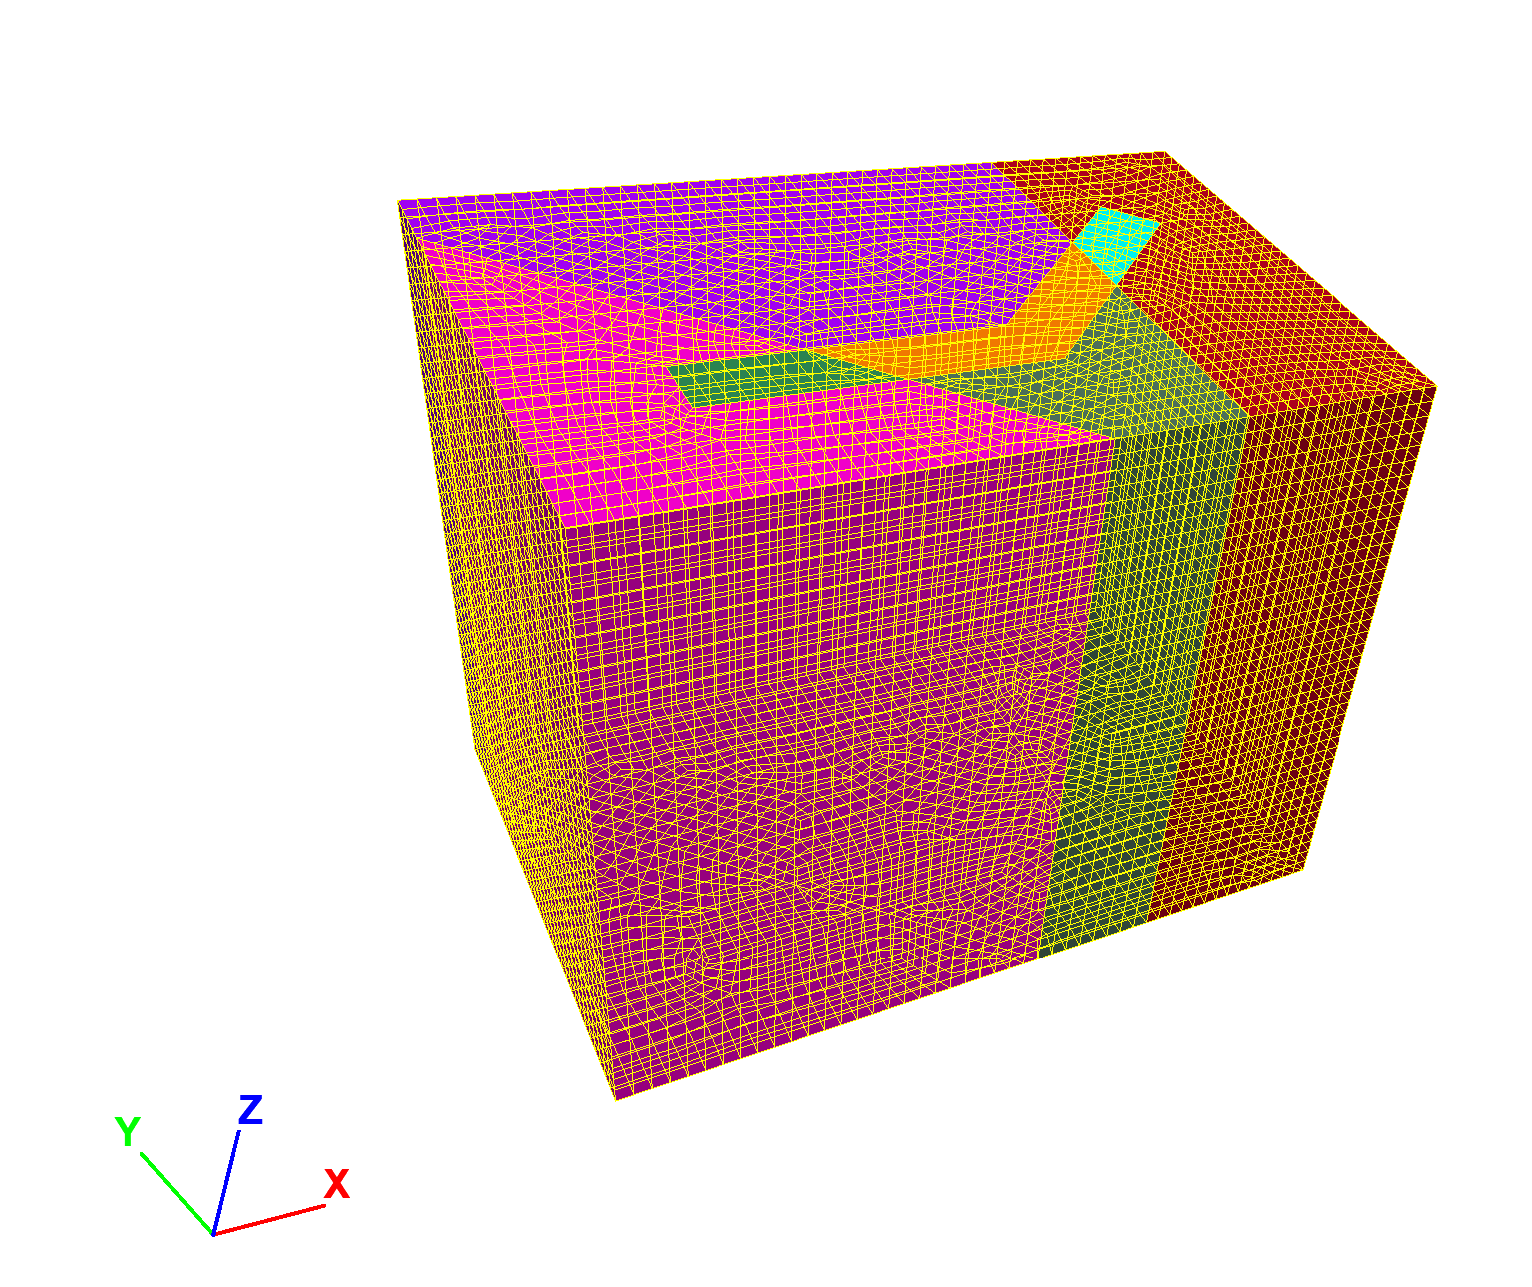
Figure 9: Densified zones.
Now, change the slot to geology. Select and hide the material outside of the orebody (group “rock”). Change the slot to Segment again. Select the top section and set its group name to upper stope in slot Default. Select the bottom section and set the group name to lower stope. Next, select the segment second from the bottom and set its group name to sill pillar 1. Select the segment just above and set the group to sill pillar 2. Change the group names for the other two segments as shown below.
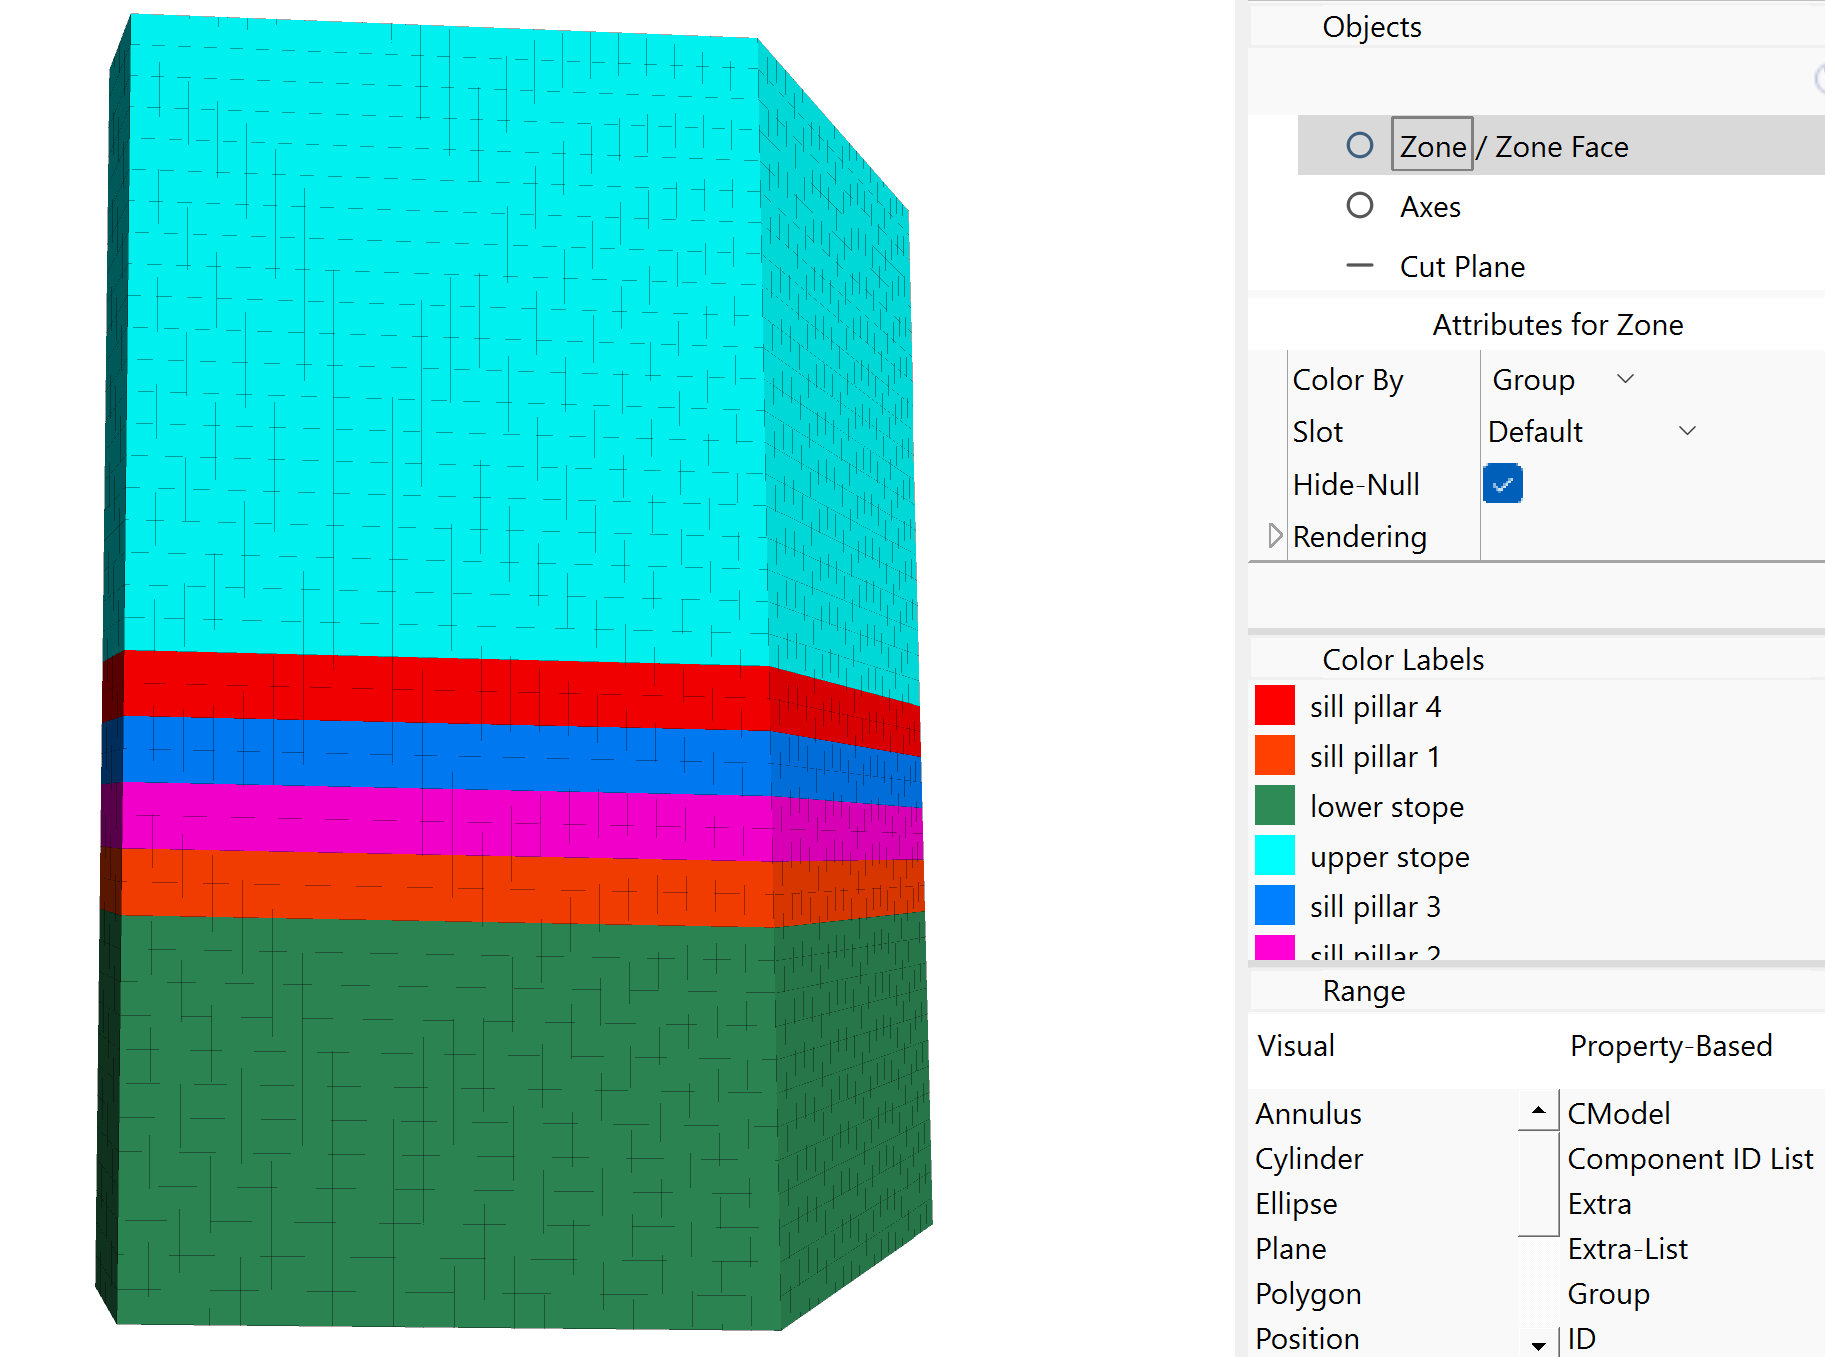
Figure 10: Group names in slot Default.
Finally, show all of the zones. Save the project and the model state.
Initial State
The rest of the model creation and solution is presented in the data files below.
In the model, the host rock, ore and fill are all assumed to behave as Mohr-Coulomb materials with properties as shown in Table 1.
The faults are assumed to behave according to the default Mohr-Coulomb joint constitutive model. The faults are modeled as zone joints. These are created, and the properties are assigned using the following commands:
zone joint configure
zone joint create by-slot 'faults' separate
contact property stiffness-normal 1e11 stiffness-shear 1e11 friction 30
Note
Important: attaching faces must be done after creating zone joints, otherwise creating the zone joints will unattach some attached faces that should remain attached.
After creating zone joints, the faces must be attached using the command zone attach by-face. This is necessary since zones were densified and there will be mismatched faces between the densified and undensified regions.
All of the model boundaries are pinned by applying a zero-velocity boundary condition in all coordinate directions using the zone face apply command. In-situ stresses are applied to the model to match the gravitational gradient with the ratio of horizontal to vertical stress equal to 1.5:1 in the \(x\)-direction and 2:1 in the \(y\)-direction. An overburden stress is applied to simulate 950 m of material above the top of the model. Also, the stresses are initialized in the zone joints based on the connected zone stresses using the command zone joint initialize-stresses.
Excavation
After the model has been brought to an initial equilibrium state, the upper and lower stopes are excavated using the zone relax command, and the model is run to equilibrium. These stopes are then backfilled with the command zone null off. To observe the change in displacements caused by each excavation stage, reset the gridpoint displacements to 0 (zone gridpoint initialize) and the fault shear displacements to 0 (contact property shear-disp). Mohr-coulomb material model is then assigned and backfill properties are given as in Table 1.
When the null zones are brought back, the zone joints also return. It is assumed that in reality there are no joints in the backfill. Therefore it is necessary to get rid of the zone joints by either (1) giving them high stiffness and strength, (2) deleting them using zone joint delete, or (3) deleting them using zone gridpoint merge all. Here option (3) is chosen. By using the all keyword with the zone gridpoint merge command, the gridpoints on either side of the joints will be merged and the joints will cease to exist. Note that option (3) wouldn’t work if there were different levels of densification in the stopes and there were mismatched gridpoints.
It is also assumed that the joints in the host rock extend to the boundary of the backfill—they are not bonded at the boundary. Care must be taken to avoid merging the gridpoints on the boundary. To do this, use the following set of commands:
zone gridpoint group 'to_merge' range group 'upper stope' or 'lower stope'
zone gridpoint group 'no_merge' range group 'sill pillar 4'
zone gridpoint group 'no_merge' range group 'rock'
zone gridpoint merge all range group 'to_merge'
Note that boundary of sill pillar 1 is not a concern since it is about to be excavated.
Excavation and filling of each section of the sill pillar then proceeds in the same manner. Following mining of the upper and lower stopes, and after each sill pillar cut, the displacements on the faults and in the zones are reset to zero so that the influence of each mining step on the faults may be determined.
Results
Figure 11 and Figure 12 show the predicted shear displacements and area of slip on Fault #1 and Fault #2, following mining of the upper and lower stopes. These plots are generated by selecting zone joints from the plot item list, then choosing Color By - Vector Qty - disp-shear. The failure state of each node on the plane is shown by plotting Contacts and choosing Color By - Text Val - state-string. Then under Color Opt, uncheck the box for the color None.
Areas on the fault that have slipped are indicated by spheres, and the shear displacement is contoured. As seen, areas of slip and shear displacement are predicted on the faults where they intersect both sides of the two excavated stopes. This is expected, since the blocks of rock are much freer to move relative to one another at the excavation boundary. The maximum shear displacement of 27.5 cm occurs where Fault #1 intersects the upper stope. In the FLAC3D model, the upper and lower stopes are excavated in a single step, then filled. In reality, the stopes were excavated and filled in an incremental fashion. So the shear displacement predicted for this stage would be expected to occur incrementally as mining progressed. The sill cut, however, is excavated and filled in an incremental fashion in the model, so that displacements can be determined as a function of mining step.
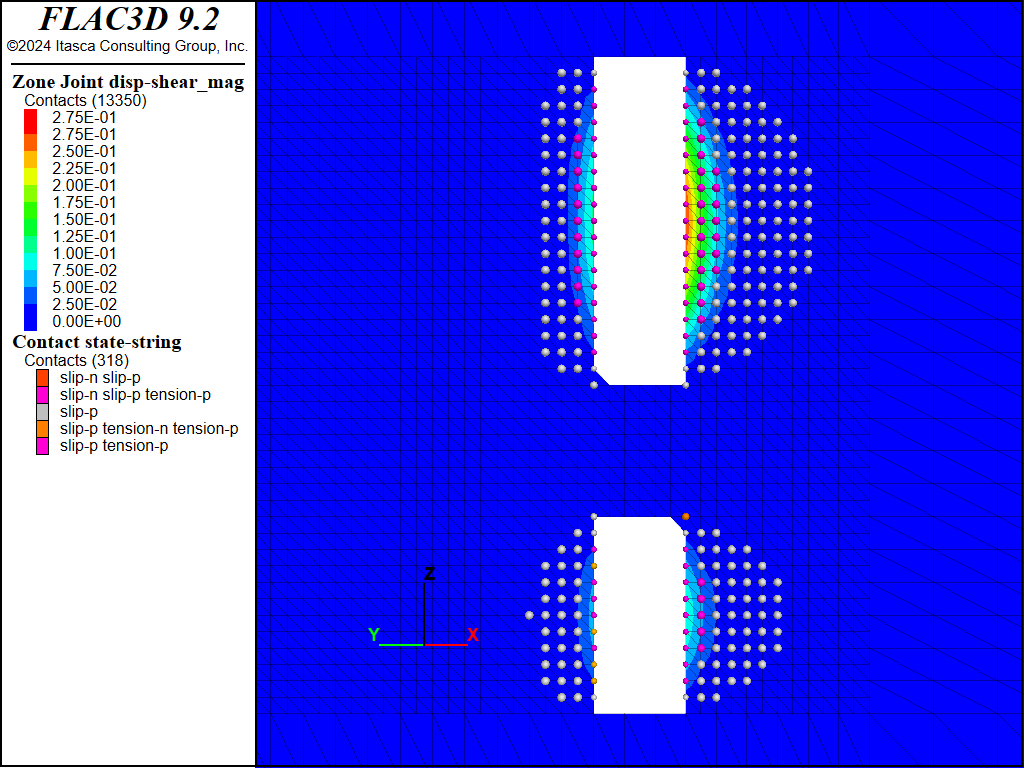
Figure 11: FLAC3D plot of shear displacement on Fault #1 following extraction of the upper and lower stopes.
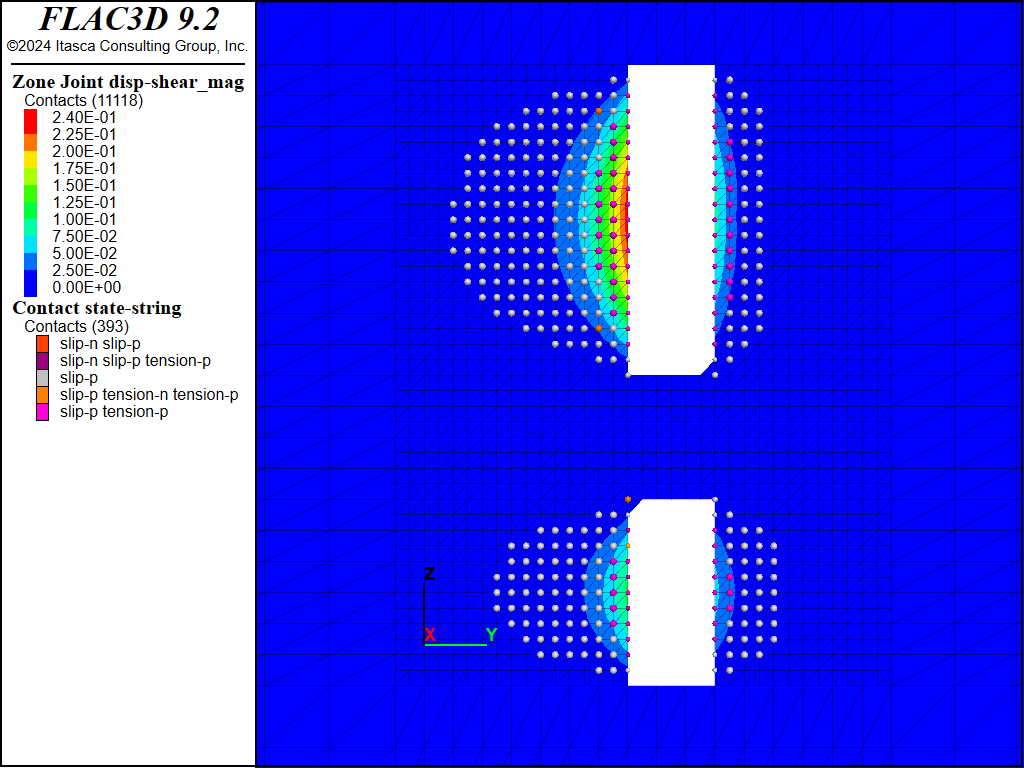
Figure 12: FLAC3D plot of shear displacement on Fault #2 following extraction of the upper and lower stopes.
Figure 13 to Figure 20 show the predicted shear displacements and area of slip on both faults for the four sill pillar cuts. For the first two cuts (Figure 13 to Figure 16), shear displacements are relatively small (<2.6 cm) and are limited to the areas on the faults adjacent to the current cut. On the third cut (Figure 17 and Figure 18), slip and shear displacement also occur in the ore between the current cut and the bottom of the upper stope. Shear displacements are on the order of 4 cm but the faults still show two mostly separate slipping patches. When the fourth and final cut is taken (Figure 19 and Figure 20), the area of slip, as denoted by contacts that have slipped in the past, is much larger (approximately 2000 m2 in size), and a maximum shear displacement of 14.5 cm is predicted on Fault #2 where it intersects the southern boundary of the excavation.
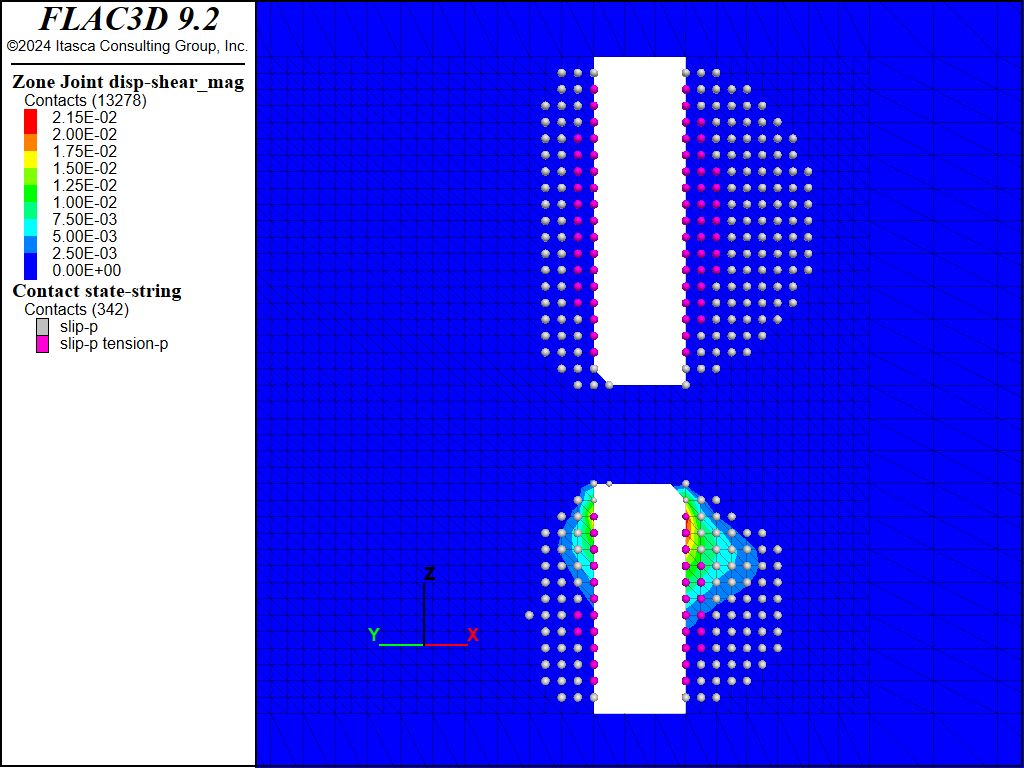
Figure 13: FLAC3D plot of shear displacement on Fault #1 following extraction of sill pillar cut #1.
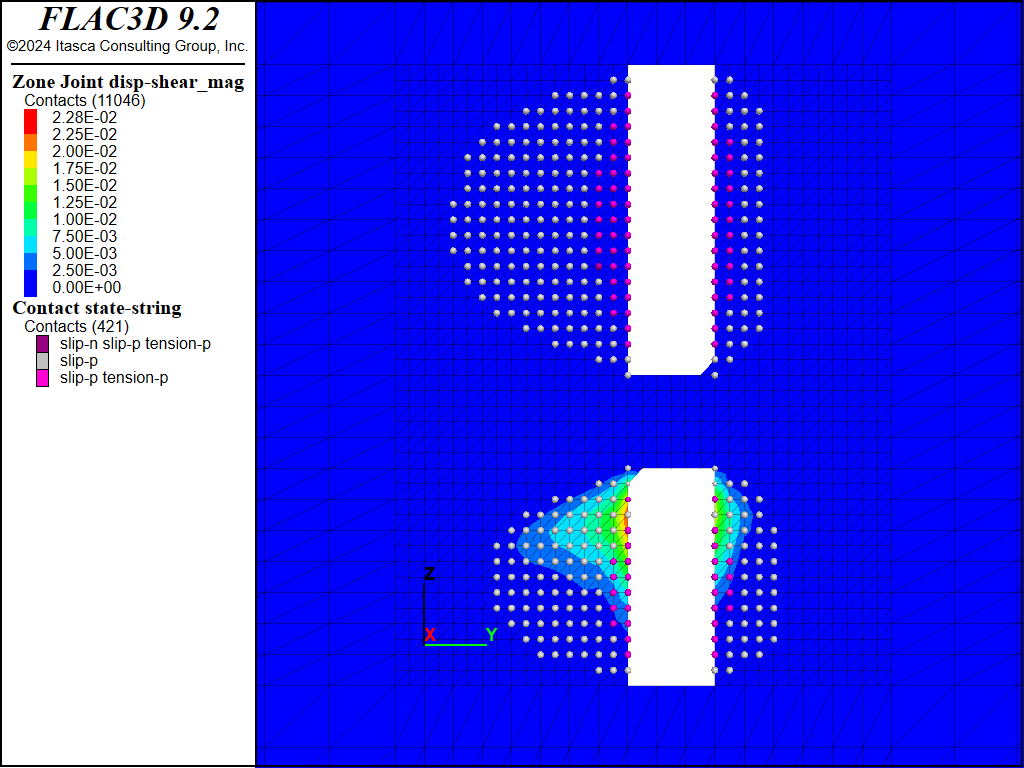
Figure 14: FLAC3D plot of shear displacement on Fault #2 following extraction of sill pillar cut #1.
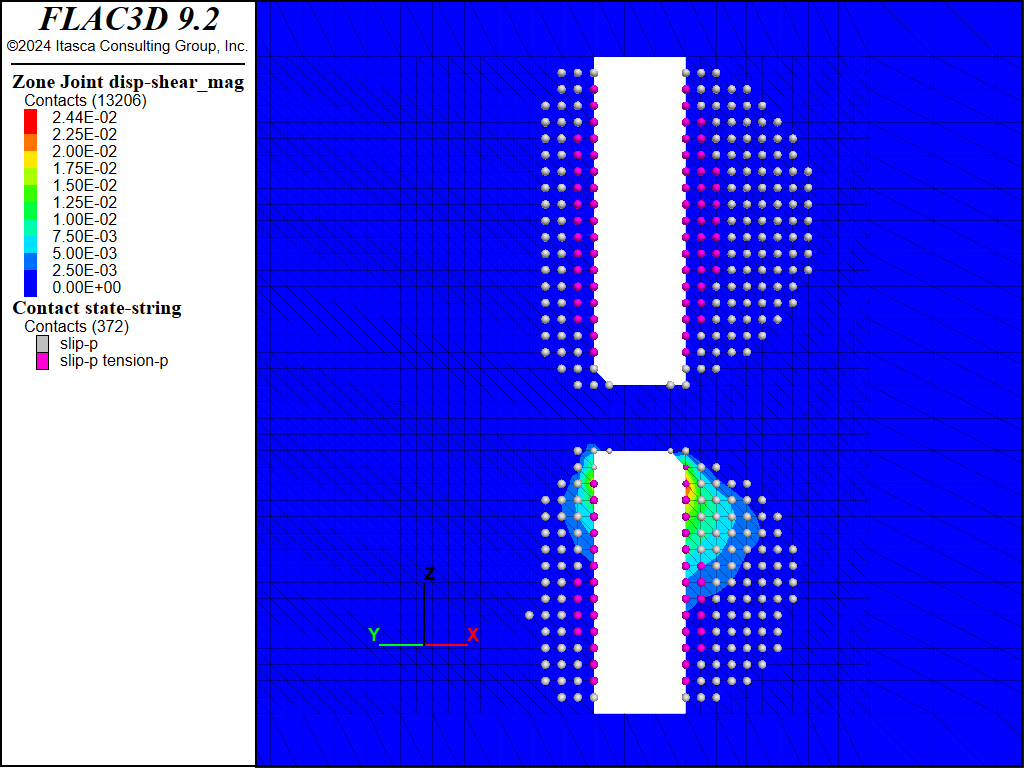
Figure 15: FLAC3D plot of shear displacement on Fault #1 following extraction of sill pillar cut #2.
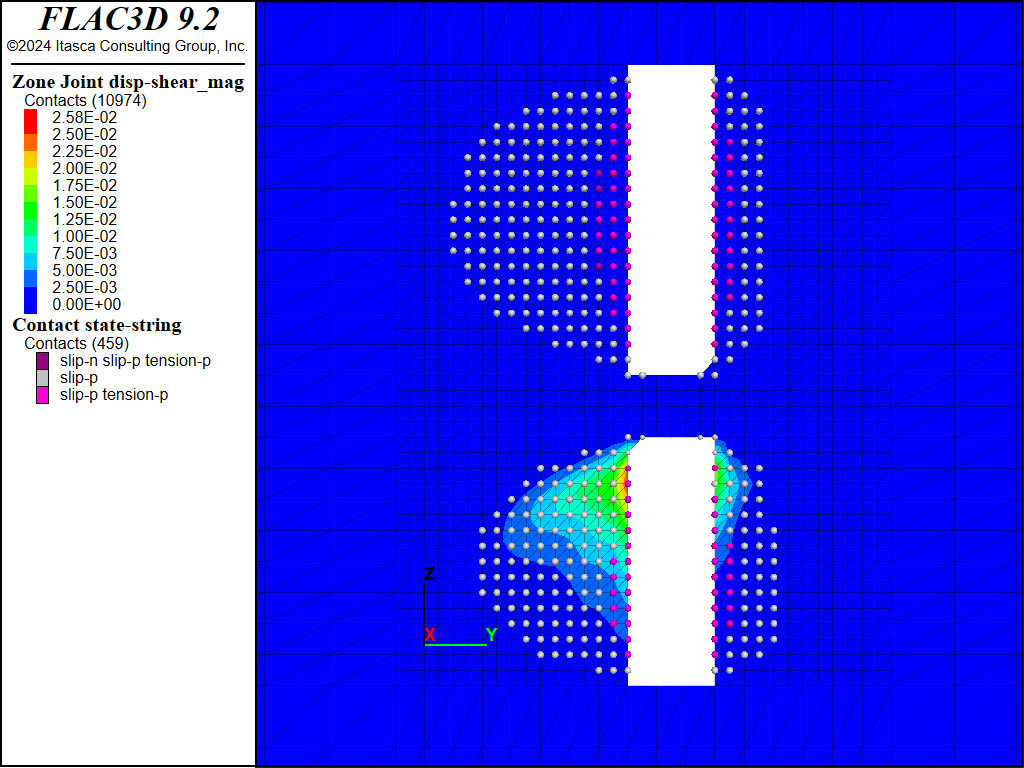
Figure 16: FLAC3D plot of shear displacement on Fault #2 following extraction of sill pillar cut #2.
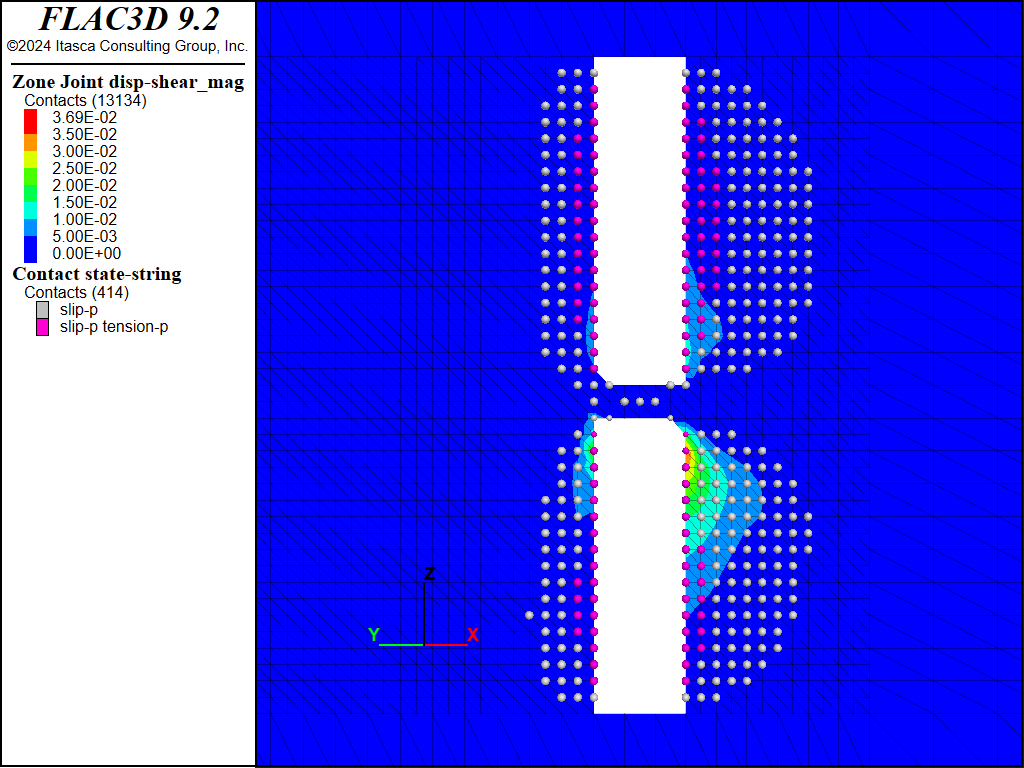
Figure 17: FLAC3D plot of shear displacement on Fault #1 following extraction of sill pillar cut #3.
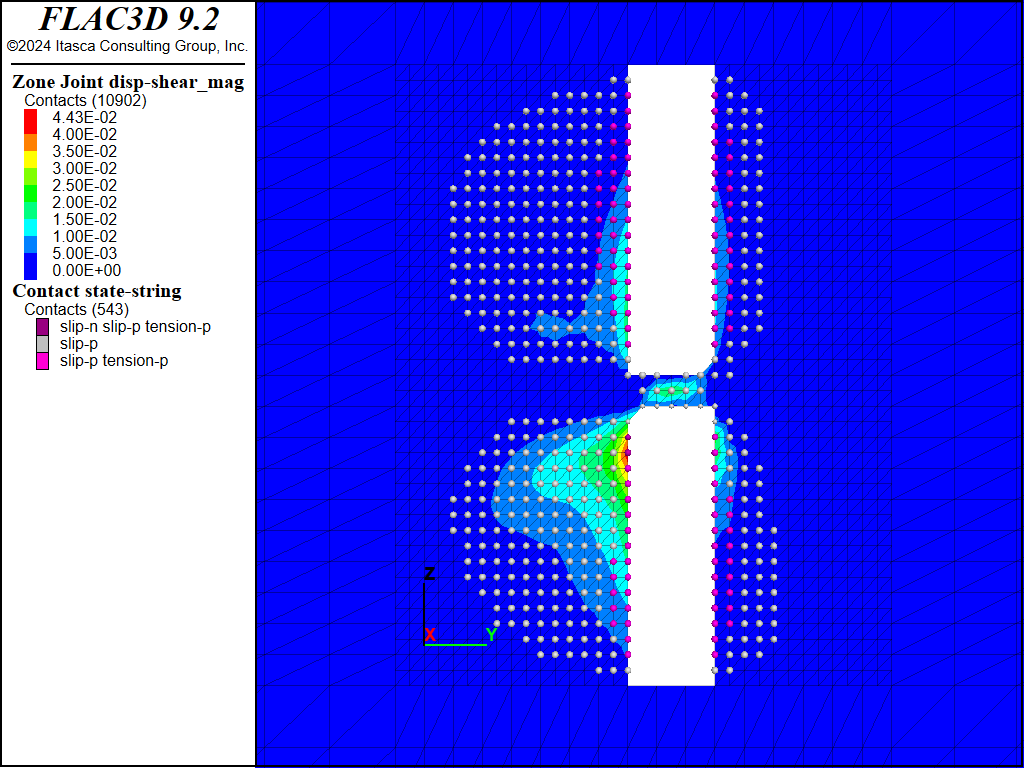
Figure 18: FLAC3D plot of shear displacement on Fault #2 following extraction of sill pillar cut #3.
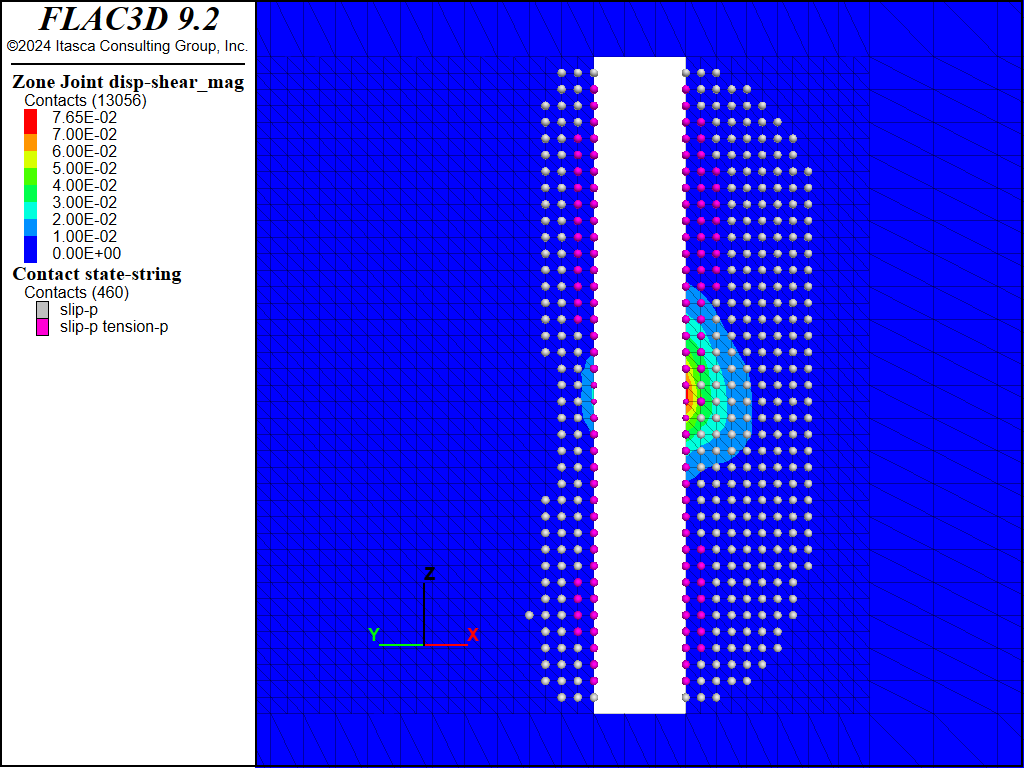
Figure 19: FLAC3D plot of shear displacement on Fault #1 following extraction of sill pillar cut #4.
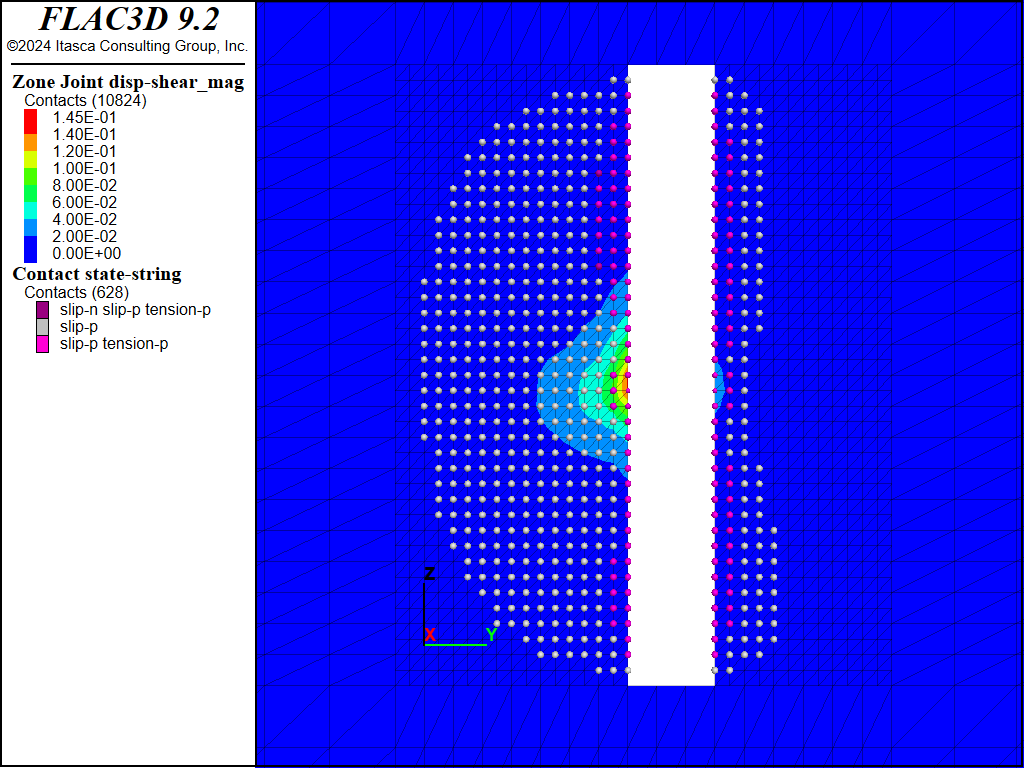
Figure 20: FLAC3D plot of shear displacement on Fault #2 following extraction of sill pillar cut #4.
Discussion
The potential energy output resulting from slip on Fault #2 at the southern boundary of the excavation due to mining of the fourth sill cut may be estimated from the seismic moment \(M_0\) (Aki and Richards 1980), which is defined by
where \(G\) is the rock mass shear modulus, \(_s\) is the average slip and \(A\) is the area over which slip occurs. A FISH function is written to estimate the moment as shown in the data files below. It is assumed that the fault area includes all contacts that have slipped and the shear displacement is the average shear displacement of all contacts in the slipped area. Based on a rock-mass shear modulus of 9.9 GPa, an average slip of 1.2 cm, and a slip area of 1994 m2, a seismic moment of 2.4 × 10¹¹ N-m is predicted.
The Richter magnitude \(M\) of a seismic event may be related to the seismic moment by the following expression (Hanks and Kanamori 1979):
For the above calculated seismic moment on Fault #2, the preceding equation gives a Richter magnitude of 1.6. Given the potential for an event of this magnitude, and the proximity of the potential rockburst to the working area, the design of a support system to resist rockburst damage in this mining scenario should be carefully considered. Other mining methods could be examined with the model to determine their potential for reducing the likelihood of large fault-slip seismic events.
Note that the magnitude estimate is quite crude and makes many assumptions including (1) the fault slips seismically, (2) all of the fault slip observed occurs at the same time, (3) all of the fault slip forms a contiguous patch of slipping fault, and (4) the Richter magnitude is a valid estimate of magnitude for this mine.
References
Aki, K., and P. G. Richards. Quantitative Seismology. W. H. Freeman & Co., San Francisco (1980).
Hanks, T. C., and H. Kanamori. “A Moment Amplitude Scale,” J. Geophys. Res., 84, 2348-50 (1979).
Data Files
initial.dat
model new
program call 'model'

;rock properties (Pa)
zone cmodel assign mohr-coulomb
zone property bulk 13.2e9 shear 9.9e9 density 2700 ...
                    cohesion 8e6 friction 43
zone property bulk 17.6e9 shear 13.2e9 ...
                    density 2700 cohesion 10e6 ...
                    friction 43 range group 'orebody'

; create faults and assign properties
zone joint configure
zone joint create by-slot 'faults' separate
contact property stiffness-normal 1e11 stiffness-shear 1e11 friction 30

; attach faces after densification
zone attach by-face

; boundary conditions
zone face apply velocity 0 0 0 range group 'East' or 'West' or ...
                    'North' or 'South' or 'Top' or 'Bottom'

; insitu stress
model gravity 9.81
zone initialize-stresses ratio 1.5 2 overburden [-950*9.81*2700]
zone joint initialize-stresses

model solve
model save 'initial'
excavate.dat
model restore 'initial'

zone gridpoint initialize displacement 0 0 0

zone relax excavate range group 'upper stope' or 'lower stope'

model solve convergence 1

model save 'exc-stopes'

===================================

; backfill
zone null off

zone gridpoint initialize displacement 0 0 0
contact property disp-shear 0 0 0

zone cmodel assign mohr-coulomb range group 'upper stope' or 'lower stope'
zone property bulk 0.03e9 shear 0.014e9 density 2000 ...
                    cohesion 0.05e6 friction 40 ...
                    range group 'upper stope' or 'lower stope'

; remove fault from backfill using MERGE ALL
; be careful not to merge gridpoints on the boundary
zone gridpoint group 'to_merge' range group 'upper stope' or 'lower stope'
zone gridpoint group 'no_merge' range group 'sill pillar 4'
zone gridpoint group 'no_merge' range group 'rock'
zone gridpoint merge all range group 'to_merge'
;
zone relax excavate range group 'sill pillar 1'

model solve convergence 1
model save 'exc-1'

=============================================

; backfill
zone null off

zone gridpoint initialize displacement 0 0 0
contact property disp-shear 0 0 0

zone cmodel assign mohr-coulomb range group 'sill pillar 1'
zone property bulk 0.03e9 shear 0.014e9 density 2000 ...
                    cohesion 0.05e6 friction 40 ...
                    range group 'sill pillar 1'

; remove fault from backfill using MERGE ALL
zone gridpoint group 'to_merge' range group 'sill pillar 1'
zone gridpoint group 'no_merge' range group 'rock'
zone gridpoint merge all range group 'to_merge'
;
zone relax excavate range group 'sill pillar 2'

model solve convergence 1
model save 'exc-2'

=============================================

zone null off

zone gridpoint initialize displacement 0 0 0
contact property disp-shear 0 0 0

zone cmodel assign mohr-coulomb range group 'sill pillar 2'
zone property bulk 0.03e9 shear 0.014e9 density 2000 ...
                    cohesion 0.05e6 friction 40 ...
                    range group 'sill pillar 2'

; remove fault from backfill using MERGE ALL
zone gridpoint group 'to_merge' range group 'sill pillar 2'
zone gridpoint group 'no_merge' range group 'rock'
zone gridpoint merge all range group 'to_merge'
;
zone relax excavate range group 'sill pillar 3'

model solve convergence 1
model save 'exc-3'

=============================================

zone null off

zone gridpoint initialize displacement 0 0 0
contact property disp-shear 0 0 0

zone cmodel assign mohr-coulomb range group 'sill pillar 3'
zone property bulk 0.03e9 shear 0.014e9 density 2000 ...
                    cohesion 0.05e6 friction 40 ...
                    range group 'sill pillar 3'

; remove fault from backfill using MERGE ALL
zone gridpoint group 'to_merge' range group 'sill pillar 3'
; note this command to merge the boundary between
; the filled upper stope and sill pillar 4
zone gridpoint group 'to_merge' range group 'upper stope' group 'sill pillar 4'
zone gridpoint group 'no_merge' range group 'rock'

zone gridpoint merge all range group 'to_merge'
;
zone relax excavate range group 'sill pillar 4'

model solve ratio 1e-6
model save 'exc-4'

fish define compute_magnitude(group,slot)
  global total_area = 0.0
  local total_slip = vector(0,0,0)
  local count = 0
  loop foreach local cp contact.list
    if contact.group(cp,slot) = group
      ; assume a threshold shear displacement of 1 mm
      if math.mag(contact.prop(cp,'disp-shear')) > 0.001
        total_area += contact.area(cp)
        total_slip += contact.prop(cp,'disp-shear')
        count += 1
      endif
    endif
  end_loop
  global avg_slip = math.mag(total_slip) / count
  global moment = avg_slip*total_area*9.9e9
  global magnitude = 2/3*math.log(moment) - 6
end
[compute_magnitude('fault 2', 'faults')]
Endnote
.. ;;;substitutions below are used to decimal align table columns| Was this helpful? ... | Itasca Software © 2024, Itasca | Updated: Dec 05, 2024 |
