
Rigid Block Model of a Rockslide
| Example Resources | |
|---|---|
| Data Files | Project: Open “RockSlide.prj”[1] in PFC3D |
Problem Statement
This example application uses rigid blocks to model a rock avalanche down a slope of Slide Mountain south of Reno, Nevada. The rigid blocks are situated adjacent to the slope that failed catastrophically on Memorial Day, 1983. The figure below shows an aerial image of the slope used in the analysis and the area that failed in 1983. The rockslide path is easily visible from the aerial image. In the 1983 event, material flowed to the floor of Washoe Valley, damaging residential homes and covering a section of U.S. Route 395. This analysis focuses on the Ophir Creek drainage, connecting Mt. Rose Meadows with Washoe Valley.
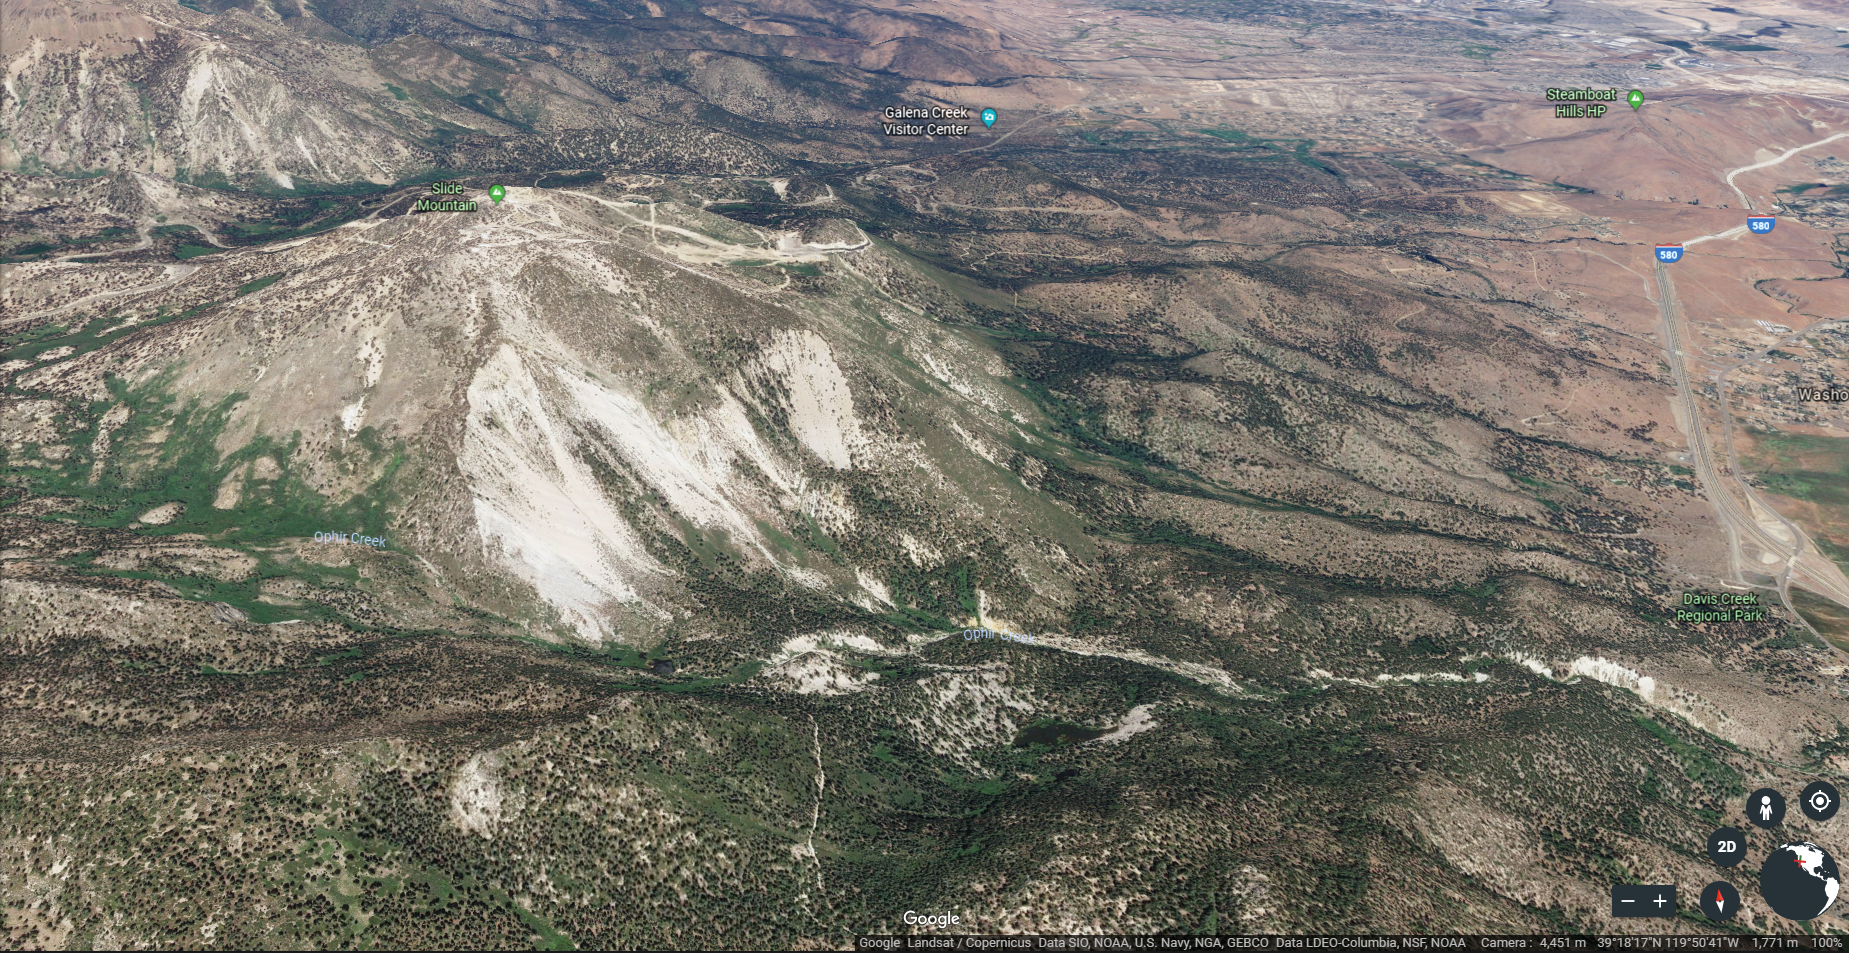
Figure 1: Google Earth image of Slide Mountain showing the failed and flow path to Washoe Valley.
The topographic model of this slope aspect is shown below. The rigid blocks are placed approximately 700 vertical meters above the Ophir Creek drainage. The topography increases on the opposite side of the drainage, creating an effective boundary to funnel material. The rigid blocks are roughly 1-2 Meters in largest length, consistent with the size of the largest material at rest in Washoe Valley.
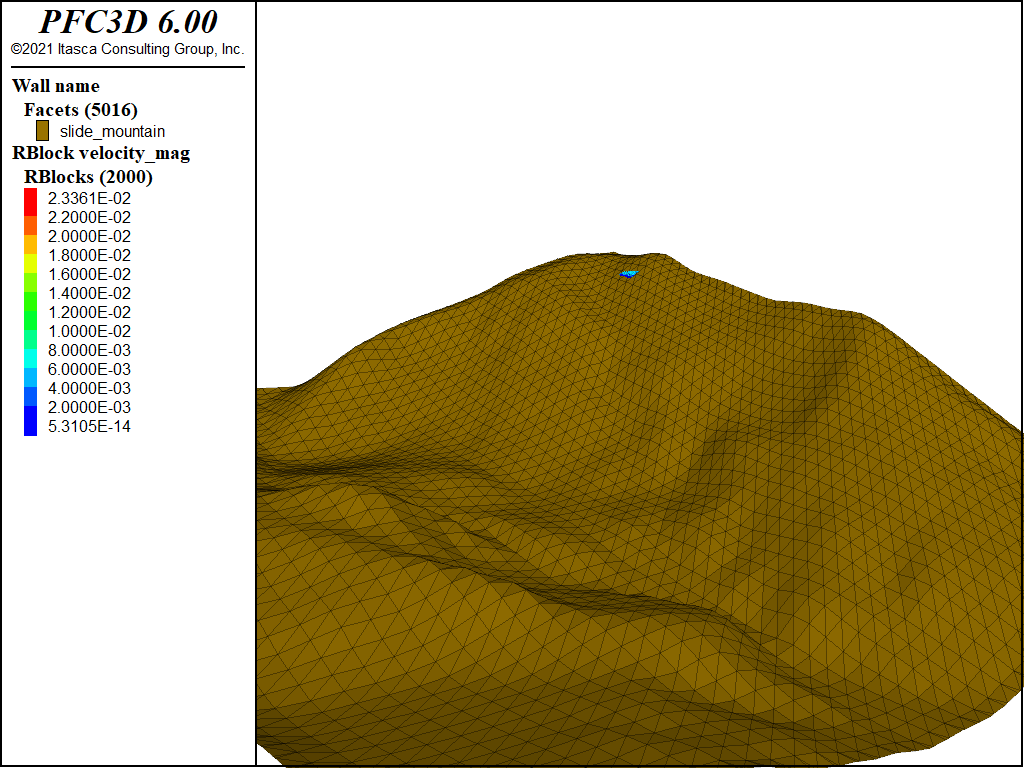
Figure 2: Digital elevation model of Slide Mountain the above Ophir Creek drainage.
Initially 6 rigid block templates are created from stl files of digitized rocks. The figure below shows the shapes of the templates. Note that rounding is introduced to speed computations; the lower row have rounding while the upper row show the core shapes. The rounding distance is computed as a percentage of the volume equivalent sphere radius.

Figure 3: Rigid block templates used in this model. The core shapes are shown above, while the rounded shapes are shown below.
From these templates, 2000 non-overlapping rigid blocks are generated using the rblock generate command. These rigid blocks are allowed to settle on the slope within a bounding box using timestep scaling and local damping. This containing box is subsequently removed and the damping and friction are modified to allow the blocks to flow down the slope. The figures below show the rigid block velocities at 2, 4, 6, 8, and 10 seconds of simulation time. The rigid blocks rapidly accelerate and spread laterally along the slope as they leave the source region. The entire set of blocks accelerate downslope due to the friction slope of the topography.
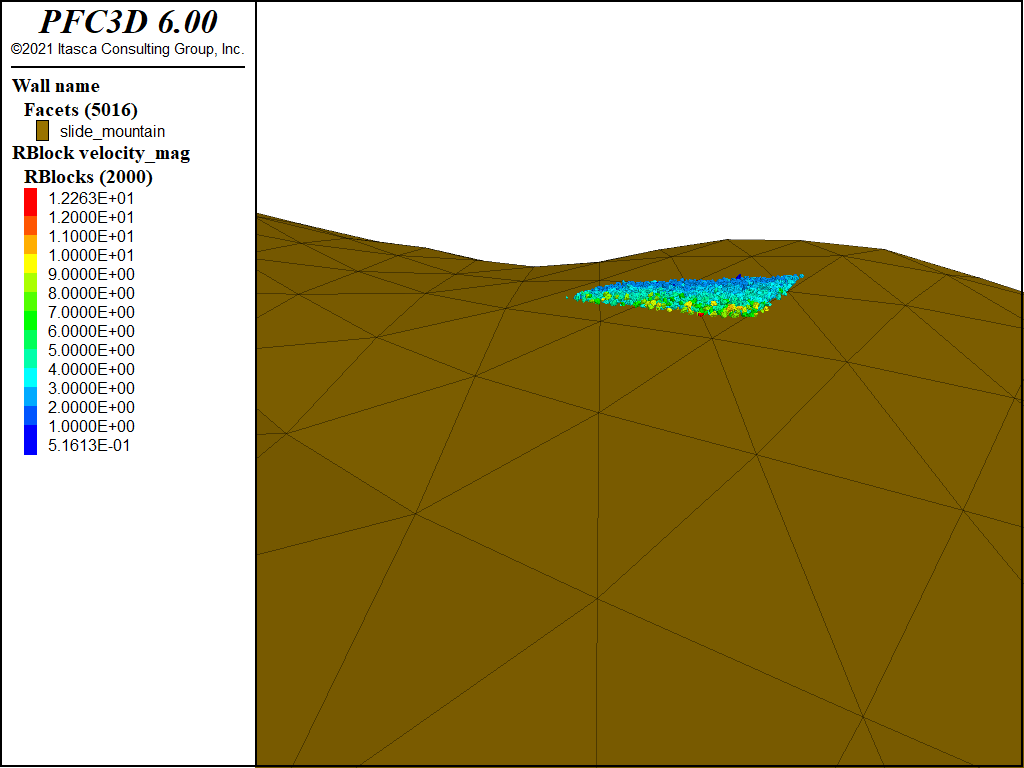
Figure 4: Rigid block velocities after 2 seconds.
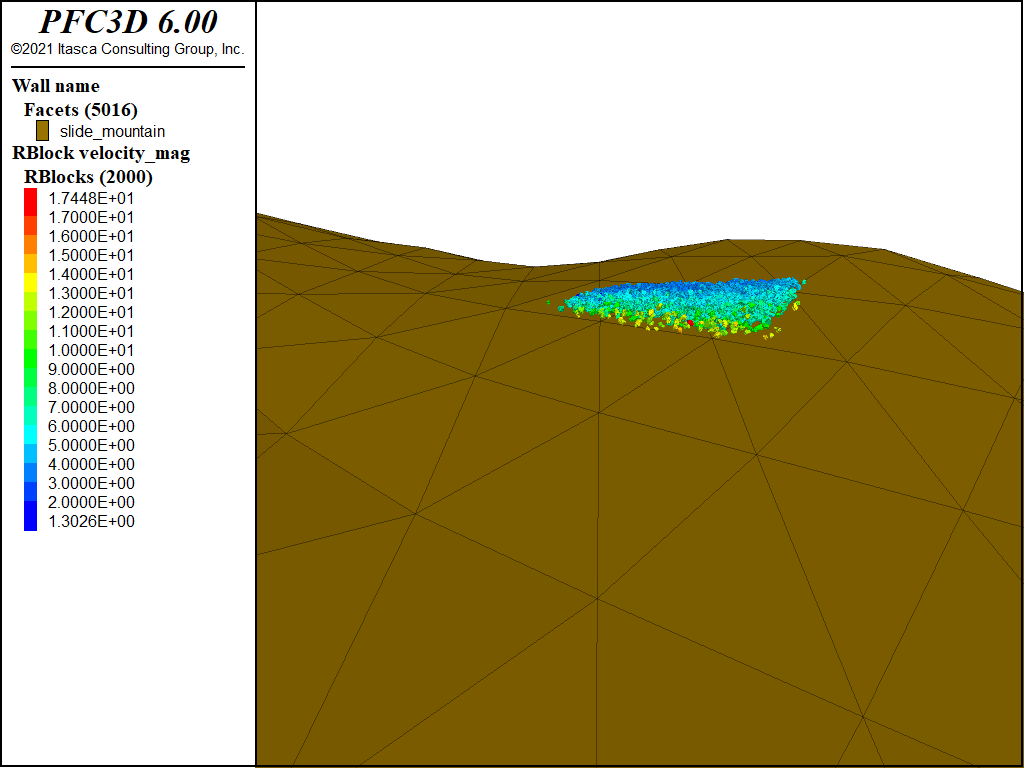
Figure 5: Rigid block velocities after 4 seconds.
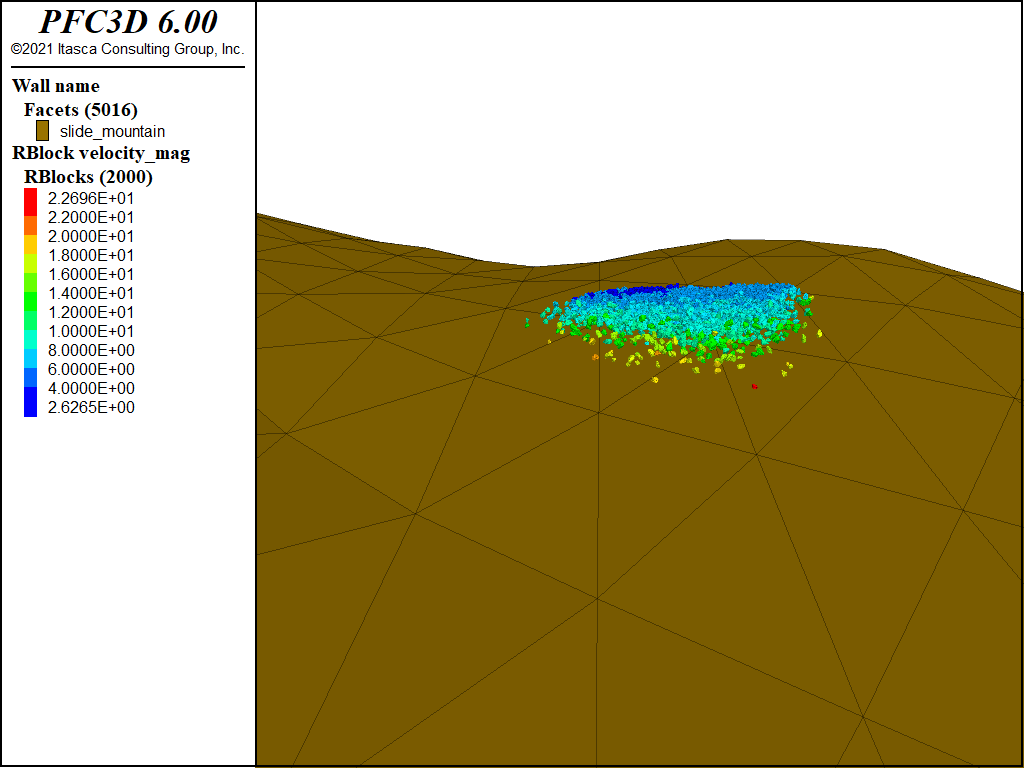
Figure 6: Rigid block velocities after 6 seconds.
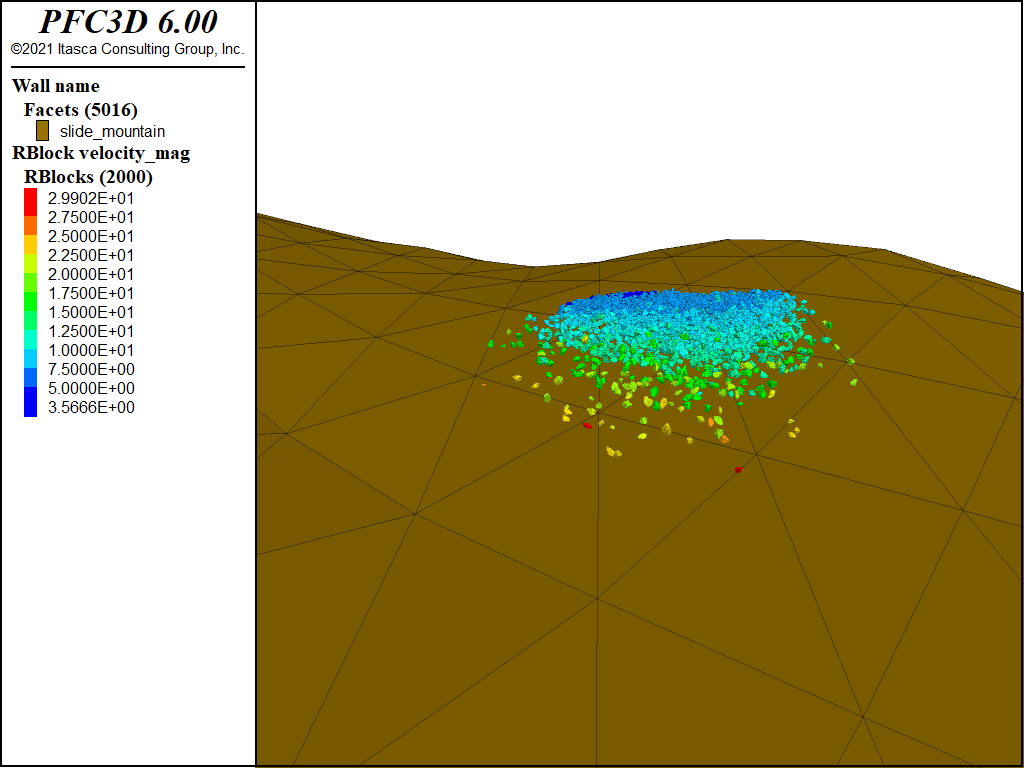
Figure 7: Rigid block velocities after 8 seconds.
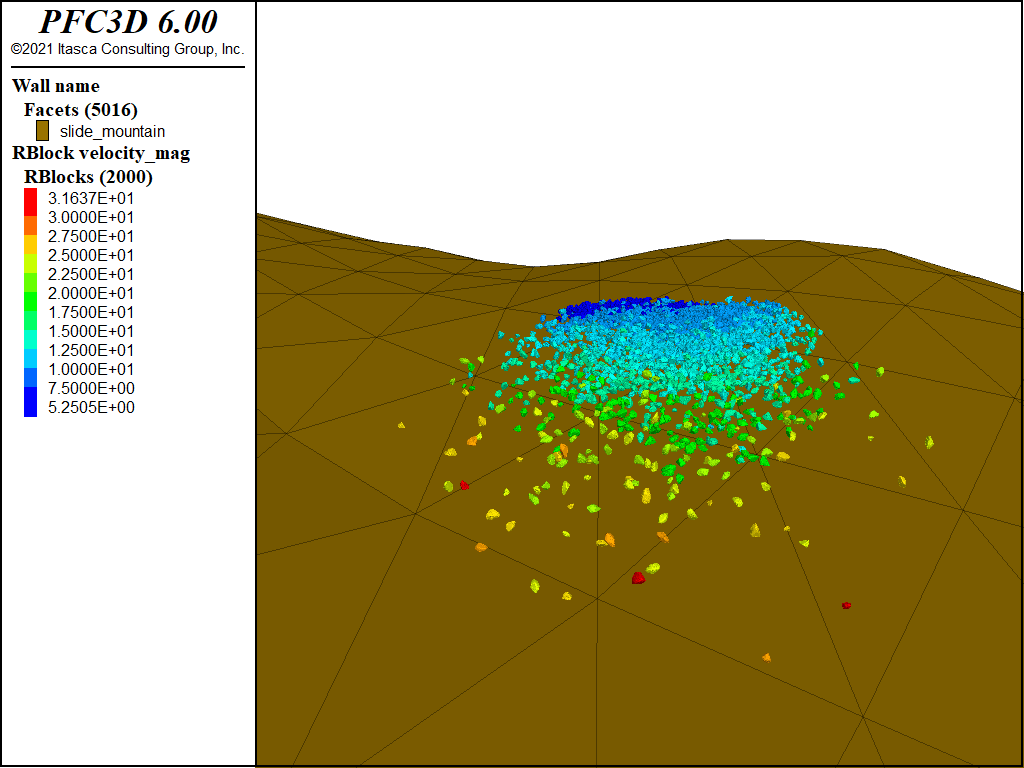
Figure 8: Rigid block velocities after 10 seconds.
The figures below show the rigid block velocities after 20 and 30 seconds of simulation time. Notice that the local topography quickly captures the flow, funneling it toward the Ophir Creek drainage. The maximum flow nearing 70 m/s are consistent with values observed in large scale rockslides.
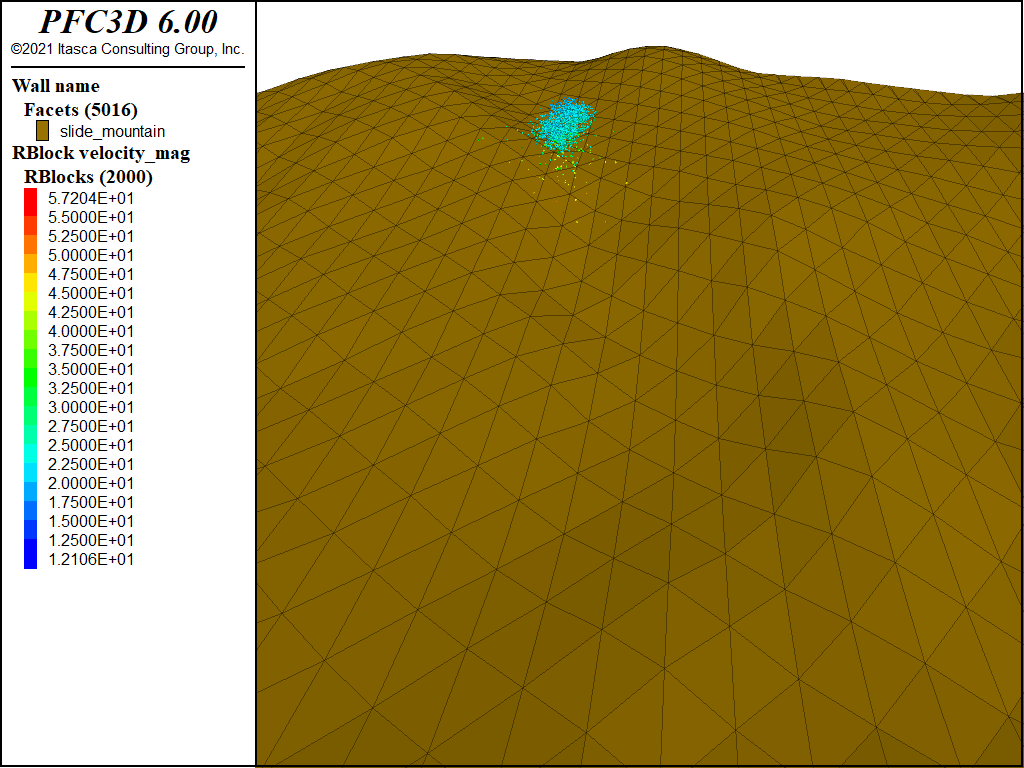
Figure 9: Rigid block velocities after 20 seconds.
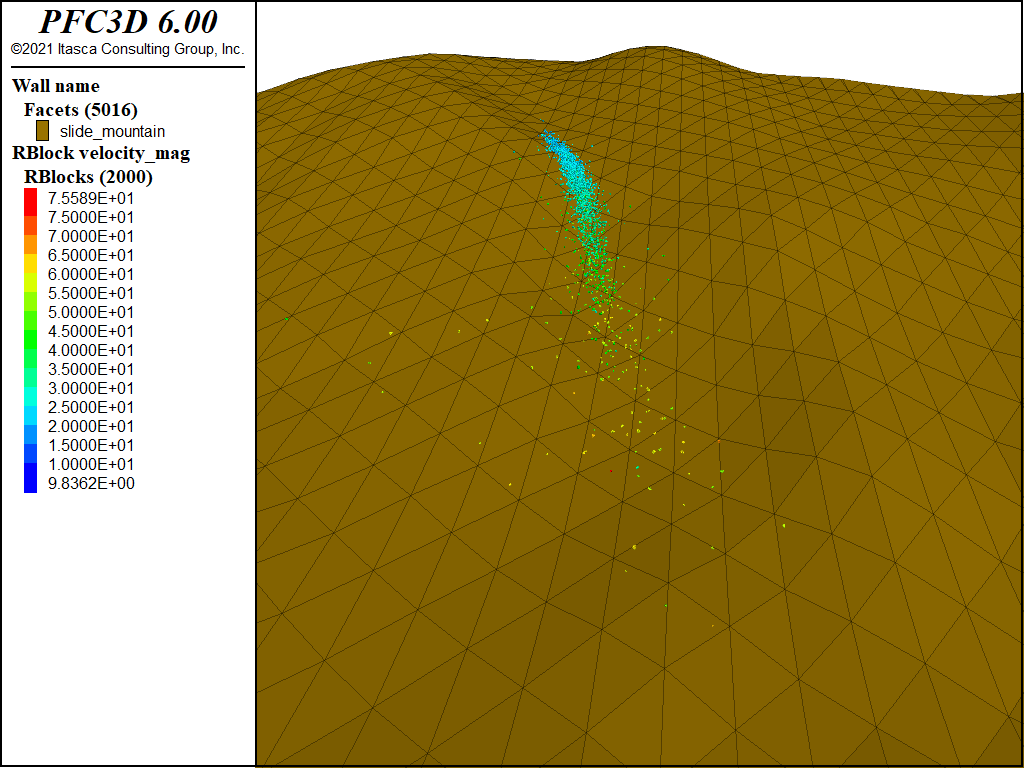
Figure 10: Rigid block velocities after 30 seconds.
| [1] | These files may be found in PFC3D under the “examples/rockslide” folder in the Examples dialog ( on the menu). If this entry does not appear, please copy the application data to a new directory. (Use the menu commands . See the “Copy Application Data” section for details.) |
| Was this helpful? ... | PFC 6.0 © 2019, Itasca | Updated: Nov 19, 2021 |