
Clump
Description
Clumps are rendered as pebbles, surfaces, arrows, or as extents, and are colored by attributes or properties.
This plot item observes the Shape/Color By/Color Opt pattern to determine its rendering.
Attributes
Shape

Select the shape with which to render clump data from the choices “Pebble”, “Surface”, “Arrow” “Minimum Extent”, “Tolerance Extent”, or “Cell Extent”. The controls provided with this field change with the selected shape. “Pebble” provides the common simple controls, “Arrow” provides the common arrow controls, and “Surface” and of the each extent options provides the common facet controls.
The “Arrow” shape may only be used with “Vector Qty” items in the Color By attribute. If Shape is set to “Arrow”, the “Text Val” and “Numeric Val” selectors in Color By are disabled, and the setting for Color By is automatically shifted to the most recent (or default) “Vector Qty” selection.
Color By
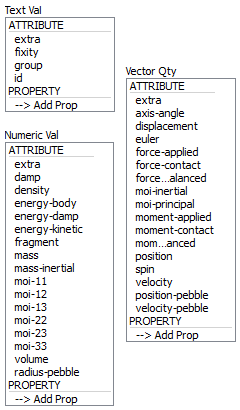
Specify what aspect of the item is to be rendered, from one of three mutually exclusive groups (only one selection from any group is active at one time): textual values, numeric values, and vector quantities. If a Vector Qty is chosen, an additional field is added to specify whether a component (\(x\), \(y\), or \(z\)) or the magnitude (mag) of the vector should be rendered.
Selecting -->Add Prop at the bottom of a selector will provide a dialog that allows the user to specify a new property to add to the list (and make it the active color by selection).
The labels ATTRIBUTE and PROPERTY on a selector do nothing; these are provided to visually differentiate the two groups.
| extra | Color by extra variable provided it is a string. An additional field is supplied to identify the variable by its index. |
| fixity | Color by fixity condition. This is represented by a string composed of component identifiers and fixity state. Clumps with no fixity applied are represented by the string {xTyTrR in 2D; xTRyTRzTR in 3D} where T stands for translation and R stands for rotation. If one of these components are fixed then the T or R is absent. |
| group | Color by group. An additional field is supplied to specify the slot index. The default setting is Any (which occupies index position 0 on the spinbox). |
| id | Color by object ID. |
| extra | Color by extra variable provided it can be converted to a floating point value. An additional field is supplied to identify the variable by its index. |
| damp | Color by the local damping coefficient. |
| density | Color by the density. |
| energy-body | Color by the body energy. |
| energy-damp | Color by the local damping energy. |
| energy-kinetic | Color by the kinetic energy. |
| fragment | Color by the fragment index. |
| mass | Color by the mass. |
| mass-inertial | Color by the inertial mass. |
| moi-11 | 11 component of the clump real moment of inertia. (3D ONLY) |
| moi-12 | 12 component of the clump real moment of inertia. (3D ONLY) |
| moi-13 | 13 component of the clump real moment of inertia. (3D ONLY) |
| moi-22 | 22 component of the clump real moment of inertia. (3D ONLY) |
| moi-23 | 23 component of the clump real moment of inertia. (3D ONLY) |
| moi-33 | 33 component of the clump real moment of inertia. (3D ONLY) |
| moi-inertial | Color by the inertial moment of inertia. |
| moi-real | Color by the moment of inertia. (2D ONLY) |
| moment-applied | Color by the applied moment. (2D ONLY) |
| moment-contact | Color by the moment resulting from contacts. (2D ONLY) |
| moment-unbalanced | Color by the unbalanced moment. (2D ONLY) |
| rotation | Color by the accumulated rotation. (2D ONLY) |
| spin | Color by the rotational velocity. (2D ONLY) |
| volume | Color by the volume {assuming unit thickness in 2D}. |
| radius-pebble | Color the pebbles by radius (not available if Shape is set to “Surface”). |
| extra | Color by extra variable provided that it is a vector. An additional field is supplied to identify the variable by its index. |
| axis-angle | |
| displacement | Color by the accumulated displacement. |
| euler | Color by the Euler angles. (3D ONLY) |
| force-applied | Color by the applied force. |
| force-contact | Color by the force resulting from contacts. |
| force-unbalanced | Color by the unbalanced force. |
| moi-inertial | Color by inertial principal moments of inertia. (3D ONLY) |
| moi-principal | Color by real principal moments of inertia. (3D ONLY) |
| moment-applied | Color by the applied moment. (3D ONLY) |
| moment-contact | Color by the moment resulting from contacts. (3D ONLY) |
| moment-unbalanced | Color by the unbalanced moment. (3D ONLY) |
| position | Color by the position. |
| spin | Color by the rotational velocity. (3D ONLY) |
| velocity | Color by the translational velocity. |
| position-pebble | Color by the pebble position (not available if Shape is set to “Surface”). |
| velocity-pebble | Color by the pebble velocity (not available if Shape is set to “Surface”). |
Color Opt

Specify options for coloring the plot item. This must be set to either scaled (contoured) coloring, or coloring based on named items (group names, for instance). See the standard Color Opt control for details.
Orientation
When orientation tracking has been enabled (see the model orientation-tracking command), a stripe
can be drawn on objects to depict their current orientations. When checked, sub-attributes provide the ability to control the stripe color, size and initial orientation.
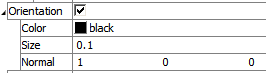
Orientation: Include (checked) indication of orientation on the plot item.
Color: Set the color used for the orientation indicator.
Size: Set the thickness of the orientation indicator.
Normal: Specify the plane of the orientation indicator in the unrotated direction.
Note: this attribute is only available when the Shape attribute is set to a representation of the plot item object (for instance, if a ball plot item’s Shape is set to “Ball”).
Scale by Mag

Object rendering is scaled according to the magnitude of the selected Vector Quantity in the Color By attribute, when checked.
Note: this attribute is only available when the Shape attribute is set to Arrow.
Both Dir

Arrow heads are rendered on both ends of the arrows representing the object, when checked.
Note: this attribute is only available when the Shape attribute is set to Arrow.
Map
Transform the orientation, location, or scale of the plot item according to the settings provided. This attribute allows multiple, differently visualized instances of a plot item to be rendered adjacent to one another, for instance.
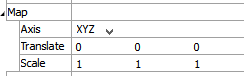
Axis: Specify a coordinate transformation to use assuming a normal order of {XY in 2D; XYZ in 3D} (XZY, for instance, indicates that the Y and Z coordinates are swapped).
Translate: Translate the rendered objects’ {\(x\) and \(y\) in 2D; \(x\), \(y\), and \(z\) in 3D} positions by the specified model units.
Scale: Set the plot item size to the specified percentage of the program window’s size.
Transparency
Set the transparency of the plot item. This setting is not available on 2D model objects.
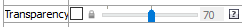
Transparency: Apply transparency (checked) to the item. When on, transparency is set to a default value of 70 and is “locked.” When locked, the available range of transparency is constrained to 70 (lowest, somewhat transparent) to 100 (highest, completely invisible). To access the full range of transparency values (0-100), press the lock icon to “unlock” the transparency range; the icon changes accordingly (
).
Use the help button to get help with this specific attribute.
Note
Users should be cautioned that values lower than 70 tend to be imperceptibly “less” transparent and they may result in depth perspectives that can seem strange or incorrect.
Legend
Set display of the item in the plot legend. All plot items, at minimum, have a Title attribute.
Legend: Show (checked) all information about the plot item in the legend.
Title: Show (checked) the title of the plot item in the legend. The “Alias:” field may be used to specify a custom title for the item.
Size: Set the size of text in the legend.
Font: Set the font face used for the text.
Style: Set the text style (the options are normal, bold, italic, bold-italic).
Color: Set the text color.
Beneath Title, the Clump plot item also provides controls in Legend for Count, Named, and Scaled.
| Was this helpful? ... | PFC © 2021, Itasca | Updated: Feb 25, 2024 |