Wave Transmission
The physical stiffness of joints in-situ can have a substantial influence on seismic wave propagation. Myer et al. (1990) present field and laboratory test results which demonstrate the effect of the stiffness of dry natural fractures in rock on high frequency attenuation, and changes in travel time of the seismic wave. It can be important to represent this effect in the discontinuum model if the wave transmission is be to modeled accurately. However, care must be taken to not introduce a numerical distortion of the wave which could mask the actual effect of the joints on wave propagation.
Numerical distortion of the propagating wave can occur in a dynamic analysis, whether it is based on a continuum or discontinuum program, as a function of the modeling conditions. Both the frequency content of the input wave and the wave speed characteristics of the system will affect the numerical accuracy of wave transmission. Kuhlemeyer and Lysmer (1973) show that for accurate representation of wave transmission through a model, the spatial element size must be smaller than approximately one-tenth to one-eighth of the wavelength associated with the highest frequency component of the input wave — i.e.,
where \(γ\) is the wavelength associated with the highest frequency component for peak velocities through the medium. For discontinuum codes, this also applies to joint spacing (or block size).
In order to achieve an accurate representation of a stress wave through a distinct element model, particularly when the joint spacing is variable, the blocks should be made deformable to accommodate the element size restriction imposed by frequency and wavelength. This is accomplished in 3DEC, as discussed in 3DEC Theory and Background, by subdividing each block into a mesh of finite-difference elements. These elements are then subject to the Kuhlemeyer and Lysmer restriction.
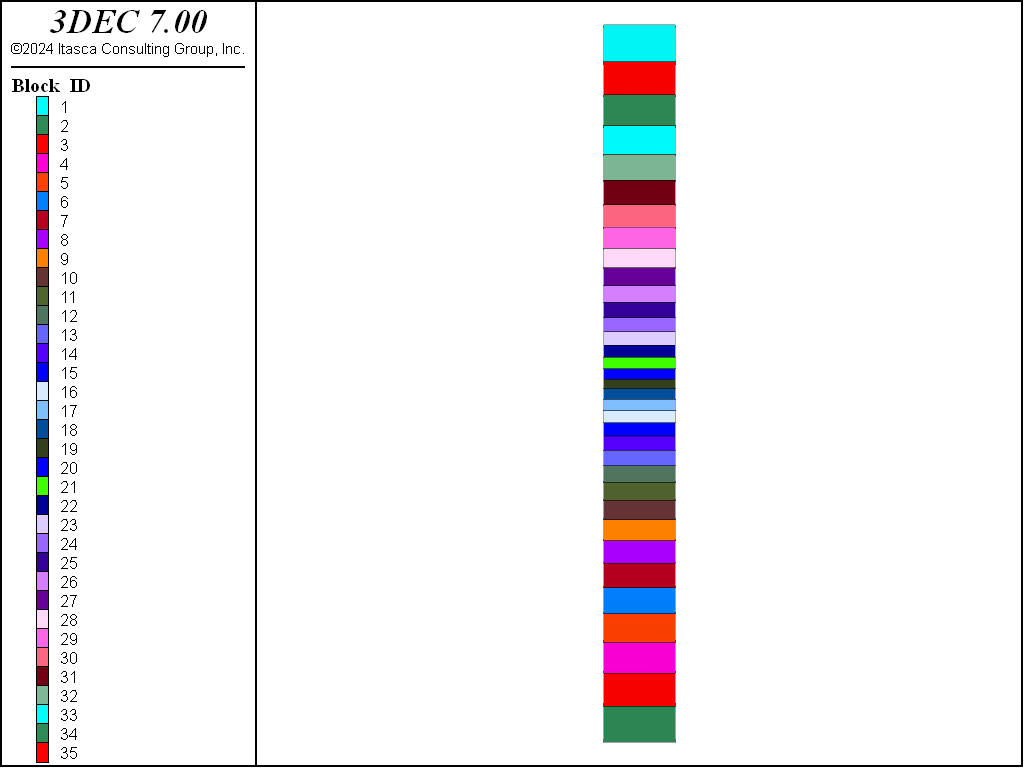
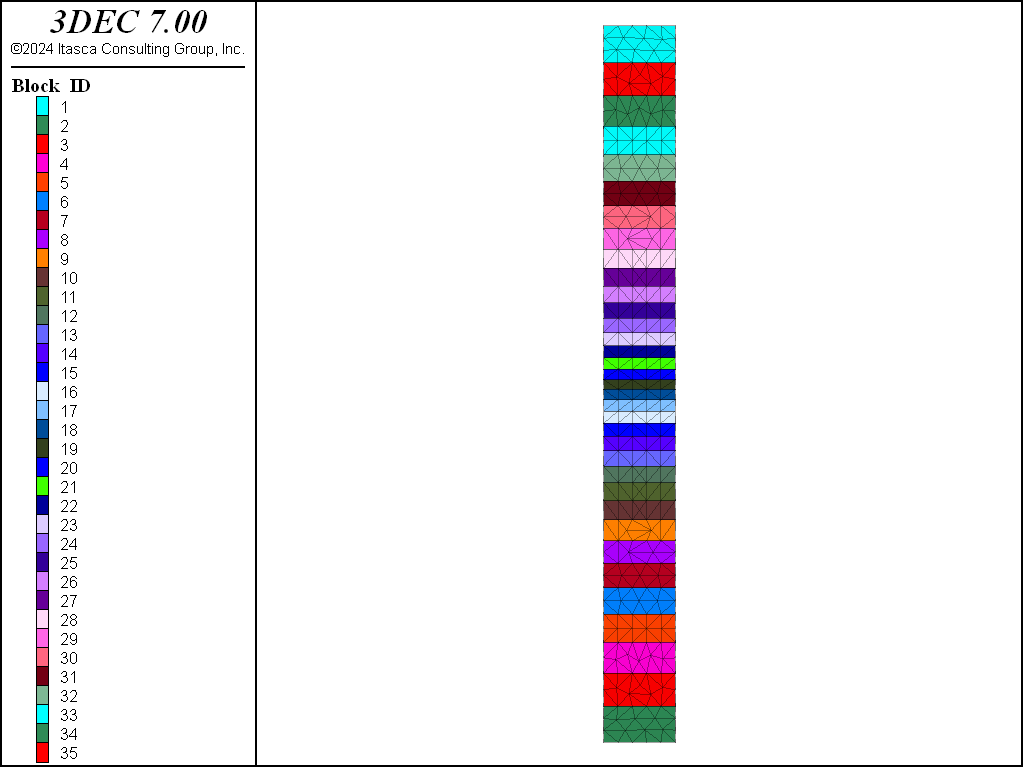
The effect of model conditions on numerical distortion of wave transmission is demonstrated by a simple analysis of a column of blocks subjected to an impulse load applied at the base (Figure 1 and Figure 3). The block sizes range from 1 m to 5 m (average size of 2 m), the contacts between blocks have a linearly elastic behavior, and the p-wave speed for the system is 4300 m/sec. A triangular-shaped impulse load, with a maximum frequency of approximately 200 Hz, is applied at the base (the solid curve in Figure 2 and Figure 4). The wavelength associated with the highest frequency of this system is 21.5 m. Thus, according to Kuhlemeyer and Lysmer, in order to transmit this wave without distortion, the element size must not exceed approximately 2 m.
A rigid block analysis is done with a constant contact normal stiffness used to produce an average wave speed of 4300 m/sec (based on the average joint spacing). A highly distorted velocity history is calculated at the top of the column, as seen by the dashed curve in Figure 2.9. This distortion can be reduced for this problem by varying the normal stiffness locally to keep the wave speed constant at contacts between blocks. However, in general, the calculation of effective (local) normal stiffnesses becomes extremely complex for a multiply jointed system, making this approach impractical.
A deformable block analysis is performed with the maximum size of the finite difference elements smaller than 2 m (see Figure 3). The elastic moduli for the blocks and the contact stiffness are calculated to produce the given \(p\)-wave speed. The distortion in the wave at the top of the column is now essentially eliminated, as indicated in Figure 4. The elastic deformation parameters represent the physical properties of the blocks and contacts separately in this case, and do not have to be adjusted locally.
Physically measured values for normal and shear stiffnesses of a geologic structure, such as joints, faults, bedding planes, etc., are not generally available. It is often necessary to back-calculate properties based on measured values for the elastic-deformation properties of the intact material and thewave speed through the jointed system. Formulae relating properties of an equivalent elastic continuum to properties for intact material and joints are given, for example, by Singh (1973) and Gerrard (1982). These relations can be used to provide reasonable estimates for joint stiffness properties in 3DEC, to produce the measured shear and compressional wave speeds of the system.
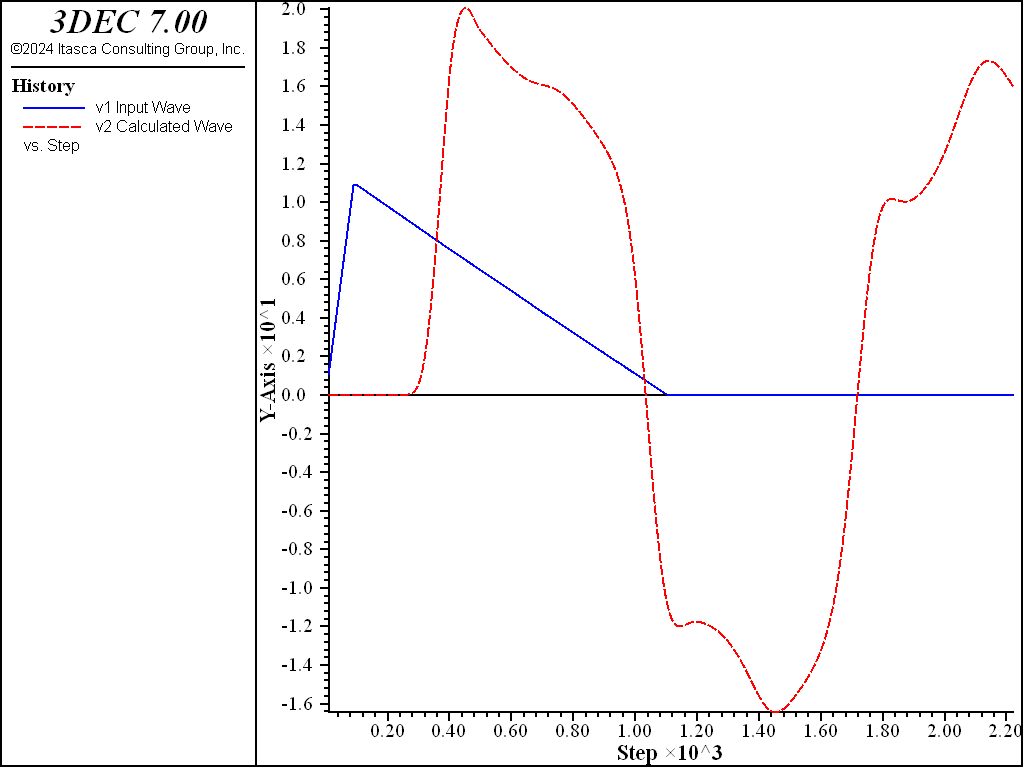
Figure 2: Input wave (solid) at base and calculated wave (dashed) at top of column of rigid block model.
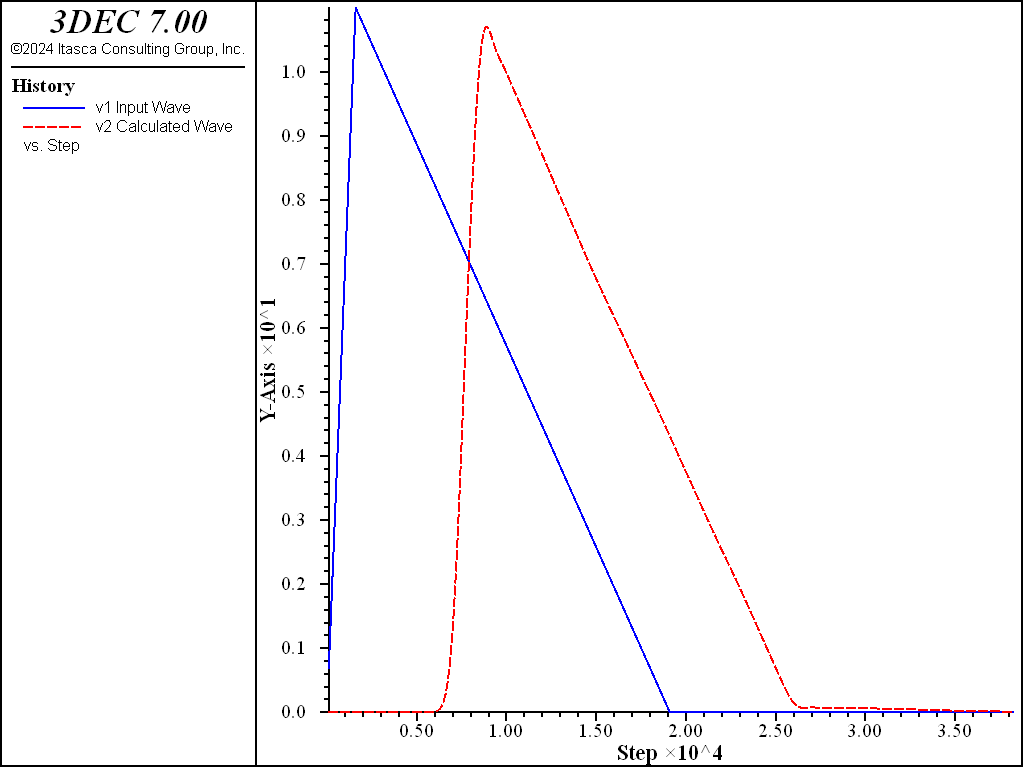
Figure 4: Input wave (solid) at base and calculated wave (dashed) at top of column of deformable block model.
Data File - Propagation through rigid blocks
;-----------------------------------------------------------------------
; Impulse applied to column of variably sized rigid blocks
;-----------------------------------------------------------------------

model new
model title "Impulse applied to column of rigid blocks"

model config dynamic
model large-strain on

;geometry
block create brick 0,10 0,10 0,100

; program call fish function to cut blocks
program call "impulse.fis"
[varcut]

block prop dens 1000

; create subcontacts and assign properties
block contact gen-sub
block contact jmodel assign el
block contact prop stiffness-normal 10e9 stiffness-shear 10e9
block contact material-table default prop stiffness-normal 10e9 ...
                                          stiffness-shear 10e9

[impulse_ini]
[vmax = 11.0]
[tpeak = 0.005]
[tend = 0.06]

; fix bottom block to apply impulse for rigid block model
block apply vel-z 1.0 fish pulse range pos-x 0,10 pos-y 0,10 pos-z 0,5

; quiet boundary at top
block gridpoint apply visc-z range pos-z 100

; monitor velocities at bottom and top
hist interval 10
block hist name 'v1' vel-z pos 0,0,0
block hist name 'v2' vel-z pos 0,0,95
fish hist pulse
model hist name 'Time' dynamic time-total
hist name 'v1' label 'Input Wave'
hist name 'v2' label 'Calculated Wave'
hist name 'Time' label 'Time'

; adip-direction 5\% stiffness damping
block mech damp rayleigh 0.05 200 stiff
model solve time-total 0.12
model save "impulse-rigid"
Data File - Propagation through deformable blocks
;-----------------------------------------------------------------------
; Impulse applied to column of variably sized deformable blocks
;-----------------------------------------------------------------------

model new
model title "Impulse applied to column of deformable blocks"

model config dynamic
model large-strain on

;geometry
block create brick 0,10 0,10 0,100

; program call fish function to cut blocks
program call "impulse.fis"
[varcut]

block zone gen edgelength 2
block zone cmodel assign el
block zone prop dens 1000 bulk 10e9 shear 7.5e9

; create subcontacts and assign properties
block contact gen-sub
block contact jmodel assign el
block contact prop stiffness-normal 200e9 stiffness-shear 200e9
block contact material-table default prop stiffness-normal 200e9 ...
                                          stiffness-shear 200e9

[impulse_ini]
[vmax = 11.0]
[tpeak = 0.005]
[tend = 0.06]

; apply pulse to bottom
block gridpoint apply vel-z 1.0 fish pulse range pos-z 0

; quiet boundary at top
block gridpoint apply visc-z range pos-z 100
block gridpoint apply vel-x 0.0 range pos-x 0
block gridpoint apply vel-x 0.0 range pos-x 10
block gridpoint apply vel-y 0.0 range pos-y 0
block gridpoint apply vel-y 0.0 range pos-y 10

; monitor velocities at bottom and top
hist interval 100
block hist name 'v1' vel-z pos 0,0,0
block hist name 'v2' vel-z pos 0,0,95
fish hist pulse
model hist name 'Time' dynamic time-total
hist name 'v1' label 'Input Wave'
hist name 'v2' label 'Calculated Wave'
hist name 'Time' label 'Time'

; adip-direction 5\% stiffness damping
block mech damp rayleigh 0.05 200 stiff
model solve time-total 0.12
model save "impulse-deformable"
For dynamic input with a high peak velocity and short rise-time, the Kuhlemeyer and Lysmer requirement may necessitate a very fine spatial mesh and a correspondingly small timestep. The effect is compounded in discontinuum codes because the wave propagation across discontinuities can produce higher frequency components than are provided in the input wave. The consequence is that reasonable analyses may be prohibitively time- and memory-consuming, as well as extremely expensive. In such cases, it may be possible to adjust the input by recognizing that most of the power for the input history is contained in lower frequency components. By filtering the history and removing high frequency components, a coarser mesh may be used without significantly affecting the results.
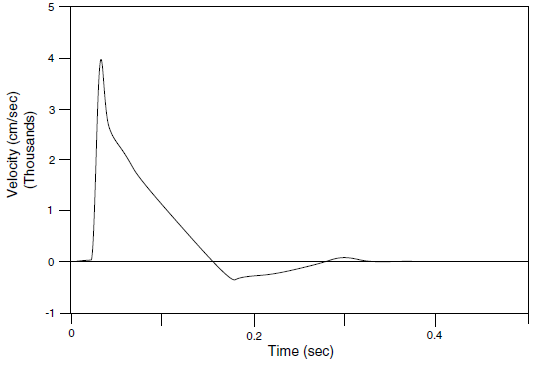
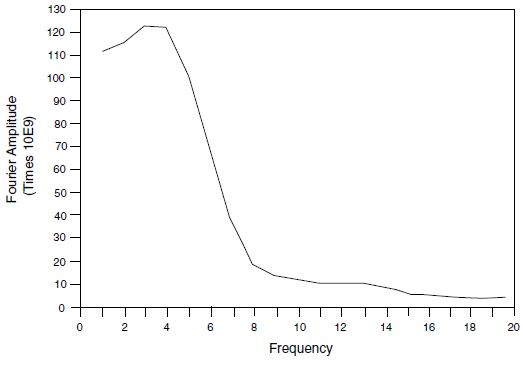
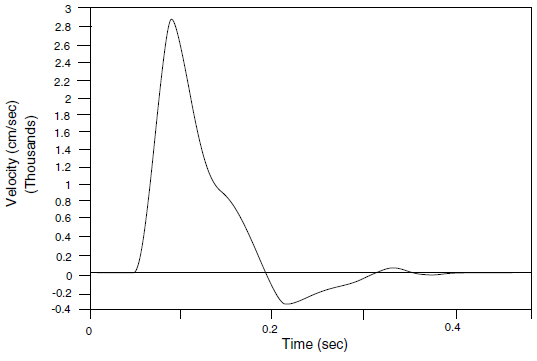
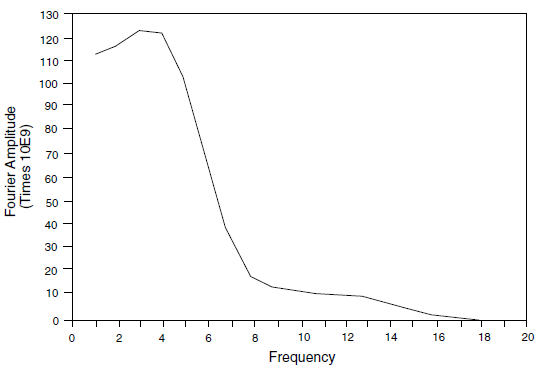
The filtering procedure can be accomplished with a low-pass filter routine such as the fast Fourier transform technique. For example, the unfiltered velocity record shown in Figure 5 represents a typical waveform containing a very high frequency spike. The highest frequency of this input exceeds 50 Hz, but, as shown by the power spectral density plot of Fourier amplitude versus frequency (Figure 6), most of the power (approximately 99%) is made up of components of frequency 15 Hz or lower. It can be inferred, therefore, that by filtering this velocity history with a 15 Hz low-pass filter, less than 1% of the power is lost. The input filtered at 15 Hz is shown in Figure 7, and the Fourier amplitudes are plotted in Figure 8. The difference in power between unfiltered and filtered input is less than 1%, while the peak velocity is reduced 38%, and the rise time is shifted from 0.035 sec to 0.09 sec. Analyses should be performed with input at different levels of filtering, to evaluate the influence of the filter on model results.
| Was this helpful? ... | 3DEC © 2019, Itasca | Updated: Feb 25, 2024 |

