DFN Fracture Contour
Description
Contour mechanical contact data on DFN fractures.
This plot item observes the Shape/Color By/Color Opt pattern to determine its rendering.
CS: this item needs verification in PFC; bug prevented checking correctness of attribute list
Attributes
Shape
Selects which shape the plot item will assume when rendered. The initial selection (“Disk,” “Cylinder,” “Sphere,” or “Contour Graph”) will determine which additional controls follow.
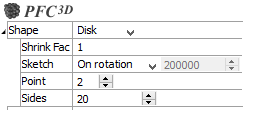
Selecting “Disk” will render the plot item as disks, with the following additional controls.
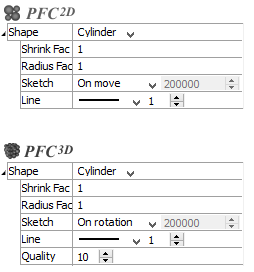
Selecting “Cylinder” will render the plot item as cylinders, with the following additional controls.
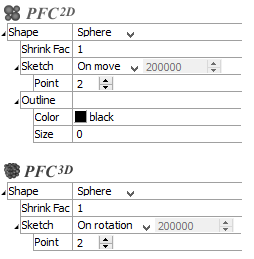
Selecting “Sphere” will render the item as spheres, with the following additional controls.
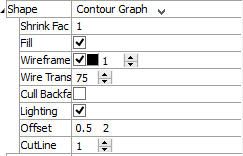
Selecting “Contour Graph” will render the item as ???, with the following sub-attributes.
Color By
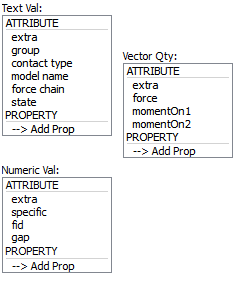
Specify what aspect of the item is to be rendered, from one of three mutually exclusive groups (only one selection from any group is active at one time): text values, numeric values, and vector quantities. If a Vector Qty is chosen, an additional field is added to specify whether a component (\(x\), \(y\), or \(z\)) or the magnitude (mag) of the vector should be rendered.
Selecting -->Add Prop at the bottom of a selector will provide a dialog that allows the user to specify a new property to add to the list (and make it the active color by selection).
The labels ATTRIBUTE and PROPERTY on a selector do nothing; these are provided to visually differentiate the two groups.
| Name | Description |
|---|---|
| extra | Colors by extra variable. An additional field is supplied to identify the variable by its index. |
| group | Colors by group. An additional field is supplied to specify the slot index. The default setting is Any (which occupies index position 0 on the spinbox). |
| contact type | |
| model name | |
| force chain | |
| state |
| Name | Description |
|---|---|
| extra | Colors by extra variable. An additional field is supplied to identify the variable by its index. |
| specific | |
| fid |
| Name | Description |
|---|---|
| extra | Colors by extra variable. An additional field is supplied to identify the variable by its index. |
| force | |
| momentOn1 | |
| momentOn2 |
Color Opt
Specify options for coloring the plot item. This must be set to either scaled (contoured) coloring, or coloring based on named items (group names, for instance). The former is the default option for numeric or vector items as set with the Color By attribute; the latter is the default setting when a textual value is specified with Color By. Setting ColorOpt to “scaled” on a textual value will result in nothing rendered. Setting a numeric or vector quantity to “named” causes the values within the numeric range to be treated as separate “names” to be colored, where the number of names is governed by the “max-names” sub-attribute.
Scaled
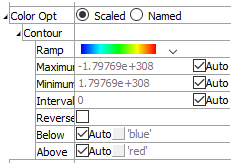
When scaled is selected, coloring is controlled by the following sub-attributes.
Contour: A container for settings that control contouring options.
Ramp: Set the color ramp to use for rendering. The five options, in order shown in the select box, are: rainbow (blue to red), grayscale, blue-white-red, blue-cyan-white-yellow-red, green-white-red.
Maximum: Set the highest value (right end) of the color ramp automatically (auto checked) or with a specified value (auto unchecked). Values above Maximum are filled with the Above color.
Minimum: Set the lowest value (left end) of the color ramp automatically (auto checked) or with a specified value (auto unchecked). Values below Minimum are filled with the Below color.
Interval: Specify the number of color intervals used in when rendering; this value defaults to a number between 8-16 if auto is checked.
Log Scale: Specify that the color intervals are logarithmically spaced when checked.
Reversed: Reverse the color sequence of the color ramp when checked.
Below: Specify which color to use for values below the Minimum. The left end of the color ramp is used with auto checked. When unchecked, the color swatch control specifies the color.
Above: Specify which color to use for values above the Maximum. The right end of the color ramp is used with auto checked. When unchecked, the color swatch control specifies the color.
Named
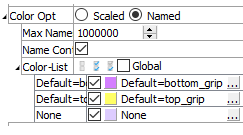
When named is selected, coloring is controlled by the following sub-attributes.
Max Names: Specify the maximum number of names and, correspondingly, the maximum number of unique colors, to be used. If more unique names exist they are assigned the name unknown and colored by a single color. The default value is 30.
Name Cont: Specify the existence of name or color controls. When many unique names (or colors) exist, the presence of the controls for each color drastically reduces rendering performance. By unchecking this option, many unique colors can be rendered efficiently.
Color List: If the plot item has selectable color items, the edit/spinbox allows specification of the number of colors to use when rendering the item. Additionally, the adjacent buttons (select all, select none, invert selection) will be active. If the plot item does not contain selectable color items, these controls are disabled. In any context, if there are colors present (colors > 0), this sub-attribute can be opened to show the list of colors used to render the plot item. The color swatches in the list may be used to change the color at the selected position. The text label adjacent to the color swatch may be edited. If there are selectable color items, each color item in the list will start with a checkbox that can be used to show (checked) or hide (unchecked) the item.
Map

Transform the orientation, location, or scale of the plot item according to the settings provided. This attribute allows multiple, differently visualized instances of a plot item to be rendered adjacent to one another, for instance.
Axis: Specify a coordinate transformation to use assuming a normal order of {XY in 2D; XYZ in 3D} (XZY, for instance, indicates that the Y and Z coordinates are swapped).
Translate: Translate the rendered objects’ {\(x\) and \(y\) in 2D; \(x\), \(y\), and \(z\) in 3D} positions by the specified model units.
Scale: Set the plot item size to the specified percentage of the program window’s size.
Resolution

Set the resolution of ???
Interpolation

Set the interpolation of ???
All Contacts

Set which contacts are displayed.
All Contacts: display (checked all contacts. If unchecked, only active contacts are shown.
CM Normal

Set display of contact model normal. This attribute is not available if Shape is set to “Arrow”.
CM Normal: Display (checked) the contact model normal, if one exists. Contact normal is displayed otherwise.
Transparency

Set the transparency of the plot item. This setting is not available on 2D model objects.
Transparency: Apply transparency (checked) to the item. When on, transparency is set to a default value of 70 and is “locked.” When locked, the available range of transparency is constrained to 70 (lowest, somewhat transparent) to 100 (highest, completely invisible). To access the full range of transparency values (0-100), press the lock icon to “unlock” the transparency range; the icon changes accordingly (
).
Use the help button to get help with this specific attribute.
Note
Users should be cautioned that values lower than 70 tend to be imperceptibly “less” transparent and they may result in depth perspectives that can seem strange or incorrect.
Legend
Set display of the item in the plot legend. All plot items, at minimum, have a Title attribute.
Legend: Show (checked) all information about the plot item in the legend.
Title: Show (checked) the title of the plot item in the legend. The “Alias:” field may be used to specify a custom title for the item.
Size: Set the size of text in the legend.
Font: Set the font face used for the text.
Style: Set the text style (the options are normal, bold, italic, bold-italic).
Color: Set the text color.
| Was this helpful? ... | 3DEC © 2019, Itasca | Updated: Feb 25, 2024 |
