Scalars
Description
User defined scalar data.
Attributes
Size By
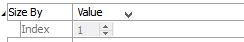
Specify how the item will be sized.
Size By: Set method of sizing the item. Options available are “Value”, “Extra”, “Uniform”, or “Pixels”. If “Extra” is selected, an Index field added to specify the index of the extra variable. If “Pixels” is selected, a Pixels field is added to specify the number of pixels to use.
Color By

Set the property to use for coloring the scalars.
Color By: Set coloring by either “Label” or “Contour”.
If Color By is set to “Label”, a Label attribute is provided to select either “Uniform”, “Value”, “Group”, or “Extra”. In addition a standard Color-List attribute (cf. Color-List in the Labels plot item) is provided.
If Color By is set to “Contour”, a Value attribute is provided to select either “Value” or “Extra”. In addition a standard Contour attribute (cf. contour in the Particle Trace plot item) is provided.
Mark
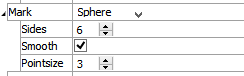
Set the shape used to render the plot item.
Mark: Set the item shape, from the options: “Point”, “Cube”, “Diamond”, “Pyramid”, “Hourglass”, “Cross”, “Sphere”.
Sketch Mode
Specify when sketch mode will be used.
Scale
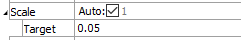
Size the plot item.
Scale: Automatically (checked) scale the plot item. The Target field specifies the target scaling (as a percentage of screen size). If unchecked, the edit field may be used to manually scale the item.
This attribute is not available if the Size By attribute is set to “Pixels”.
Color-List
Configure the list used to color the plot item.
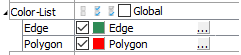
Color-List: Set which items on the list are displayed. The field contains “Select None”, “Select All”, and “Invert Selection” buttons, respectively. These are followed by the “Global” checkbox, which, if checked, causes the current pairing of colors and labels to be used globally across all plots. For example, if a specific, consistent color is desired for group names that appear in all plots, this setting will be useful.
This field is also a container for the items on the list.
[Item]: When the list contains one or more items, they are listed beneath the main field. The item’s name is used as a label for the field. If checked, the item is displayed. Next a color control appears to set/indicate the item color. The current label for the item appears next; initially this defaults to the item name. The settings button (…) may be used to set an “alias” that can be used instead of the item name when displayed in the legend.
Transparency
Set the transparency of the plot item. This setting is not available on 2D model objects.
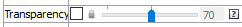
Transparency: Apply transparency (checked) to the item. When on, transparency is set to a default value of 70 and is “locked.” When locked, the available range of transparency is constrained to 70 (lowest, somewhat transparent) to 100 (highest, completely invisible). To access the full range of transparency values (0-100), press the lock icon to “unlock” the transparency range; the icon changes accordingly (
).
Use the help button to get help with this specific attribute.
Note
Users should be cautioned that values lower than 70 tend to be imperceptibly “less” transparent and they may result in depth perspectives that can seem strange or incorrect.
Legend
Set display of the item in the plot legend. All plot items, at minimum, have a Title attribute.
Legend: Show (checked) all information about the plot item in the legend.
Title: Show (checked) the title of the plot item in the legend. The “Alias:” field may be used to specify a custom title for the item.
Size: Set the size of text in the legend.
Font: Set the font face used for the text.
Style: Set the text style (the options are normal, bold, italic, bold-italic).
Color: Set the text color.
| Was this helpful? ... | 3DEC © 2019, Itasca | Updated: Feb 25, 2024 |