Examples • Example Applications
Post-peak Pillar Behavior and the Effects of Backfill Confinement (FLAC2D)
Problem Statement
Note
This project reproduces Example 5 from FLAC 8.1. The project file for this example is available to be viewed/run in FLAC2D.[1] The project’s main data files are shown at the end of this example.
A room-and-pillar mine is presently experiencing a slow but progressive collapse of pillars. The present analysis attempts to answer the follwing questions. Should backfill be poured around the pillars, which have not yet failed, in an attempt to increase their peak strength and/or residual strength? How is the stress-strain curve for rib pillars affected by backfilling? And how important is a gap between the backfill and the roof?
The orebody seam is approximately 8 m high and dips at 20°. Underground observation shows that hangingwall and footwall contacts are coated with talcy minerals and exhibit substantial recent movement.
Modeling Procedure
Three cases are studied with FLAC2D for this example:
Case 1 |
no backfill; |
Case 2 |
tight backfill; and |
Case 3 |
backfill with a 10 cm gap. |
The model geometry for all three cases is created in the Sketch workspace by following the steps outlined below; the geometry is shown in Figure 1:
A polyline is drawn through (0,0), (0,40), (30,29), (30,-11)
A line is drawn from 0,24 to 30,13
A line is drawn from 0,16 to 30,5
A vertical line is drawn from 9.5,-4 to 9.5,37. Depending on the screen resolution, it may be desirable to the points first and then join them with a line. Any points dangling outside of the model should be deleted.
A vertical line is drawn from 20.5,-8 to 30.5,33. The two points dangling outside of the model are then deleted.
The zone size is set to 1 and all blocks are meshed.
The number of zones to the left and right of the region of interest is set to 5 and the ratio is set to 1.5 (the ratio will automatically reverse on the right side).
The number of zones above and below the region of interest is set to 5 and the ratio is set to 1.5.
The middle block is assigned the group name
pillarand the blocks to the left and right are assigned the group namebackfill.The three blocks above the pillar and the three blocks below the pillar are assigned the group name
rock.Zones are generated.
The state record is saved as a data file (
model.dat) for later use.
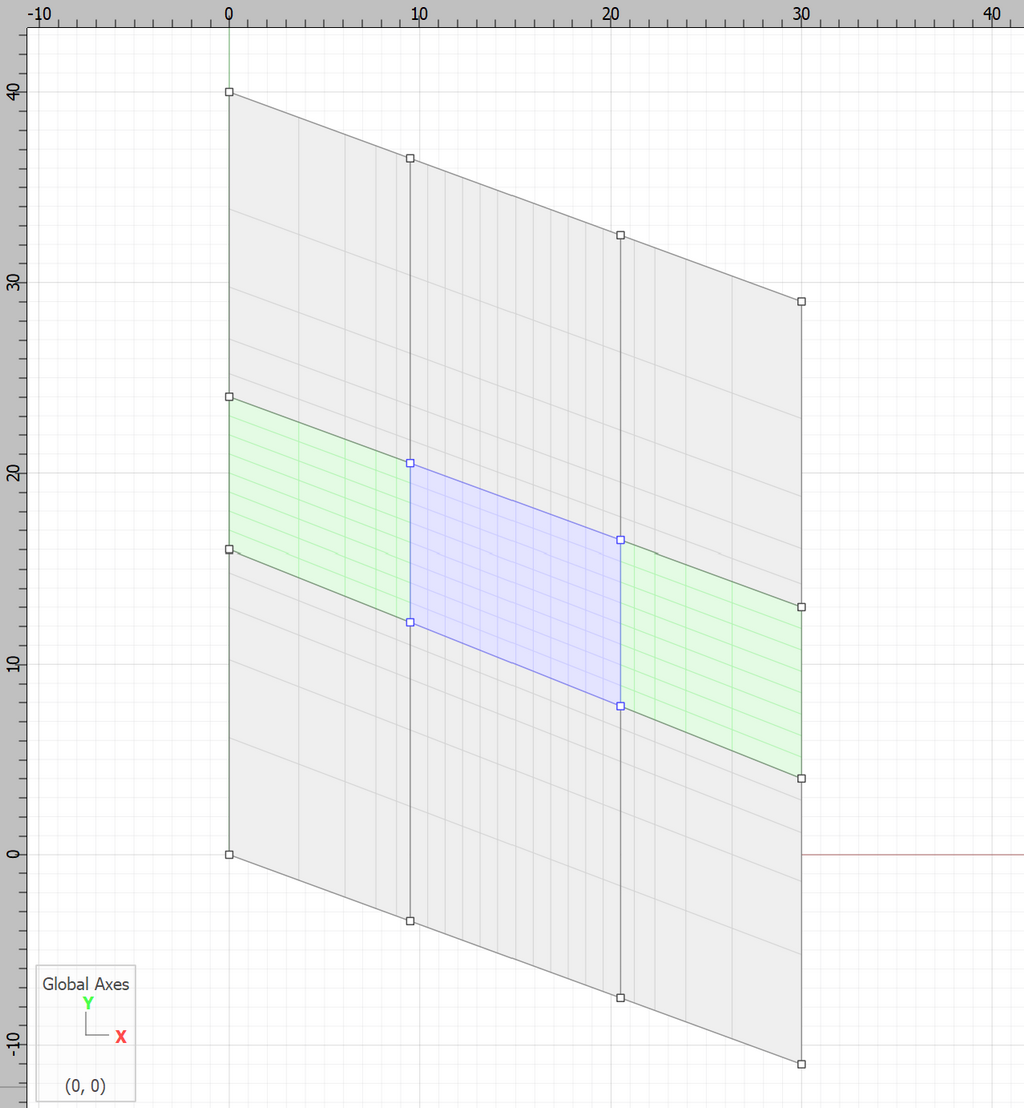
Figure 1: Sketch design of a pillar (in blue) in a dipping seam. Backfill regions are highlighted in green.
Zones generated for the model are shown in Figure 2.
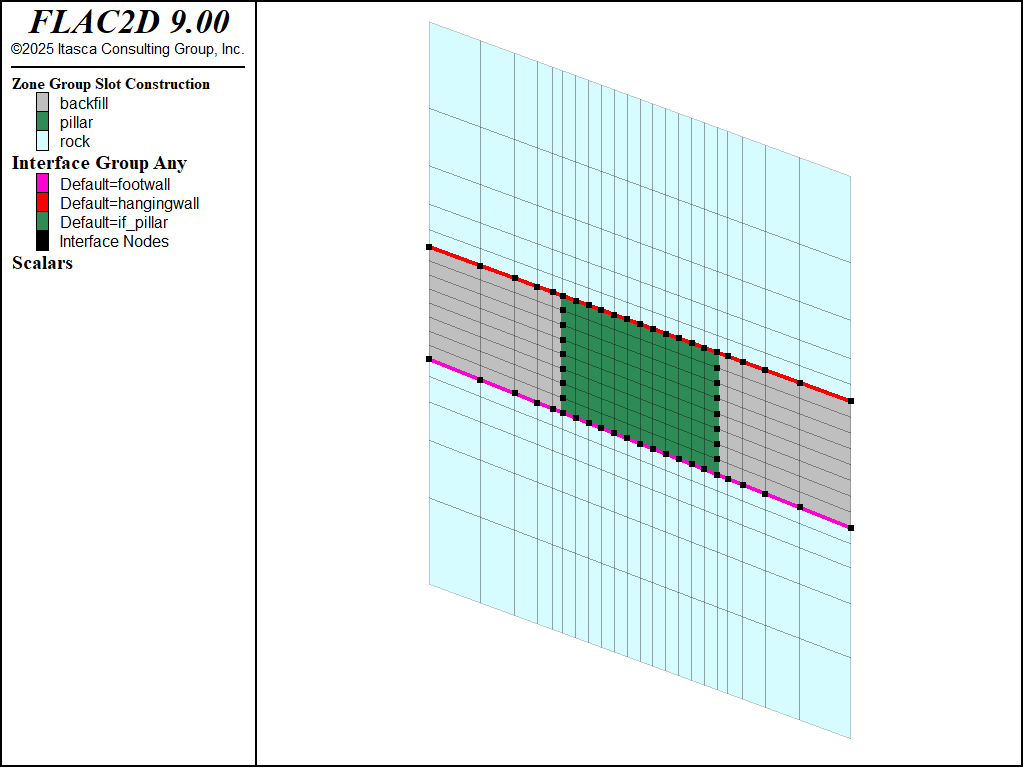
Figure 2: FLAC2D model of a pillar in a dipping seam.
Interfaces are placed between the pillar and the hangingwall, and between the pillar and the footwall, to simulate the sliding contacts. The interfaces in FLAC2D are one sided, and it is best to attach the interfaces to the smaller surface. In this case be sure to attach the interface to the top and bottom of the pillar - not the hangingwall and footwall. To make the interfaces in this way, follow these steps in the Model workspace:
Click the tool button to Assign group names to faces automatically. Leave the box checked to assign group names to faces inside the model.
Select the vertical face on the right side of the pillar. Select Create an interface from the drop-down menu on the tool bar. Choose Construction=backfill for the new faces and name the interface if_pillar (Figure 3).
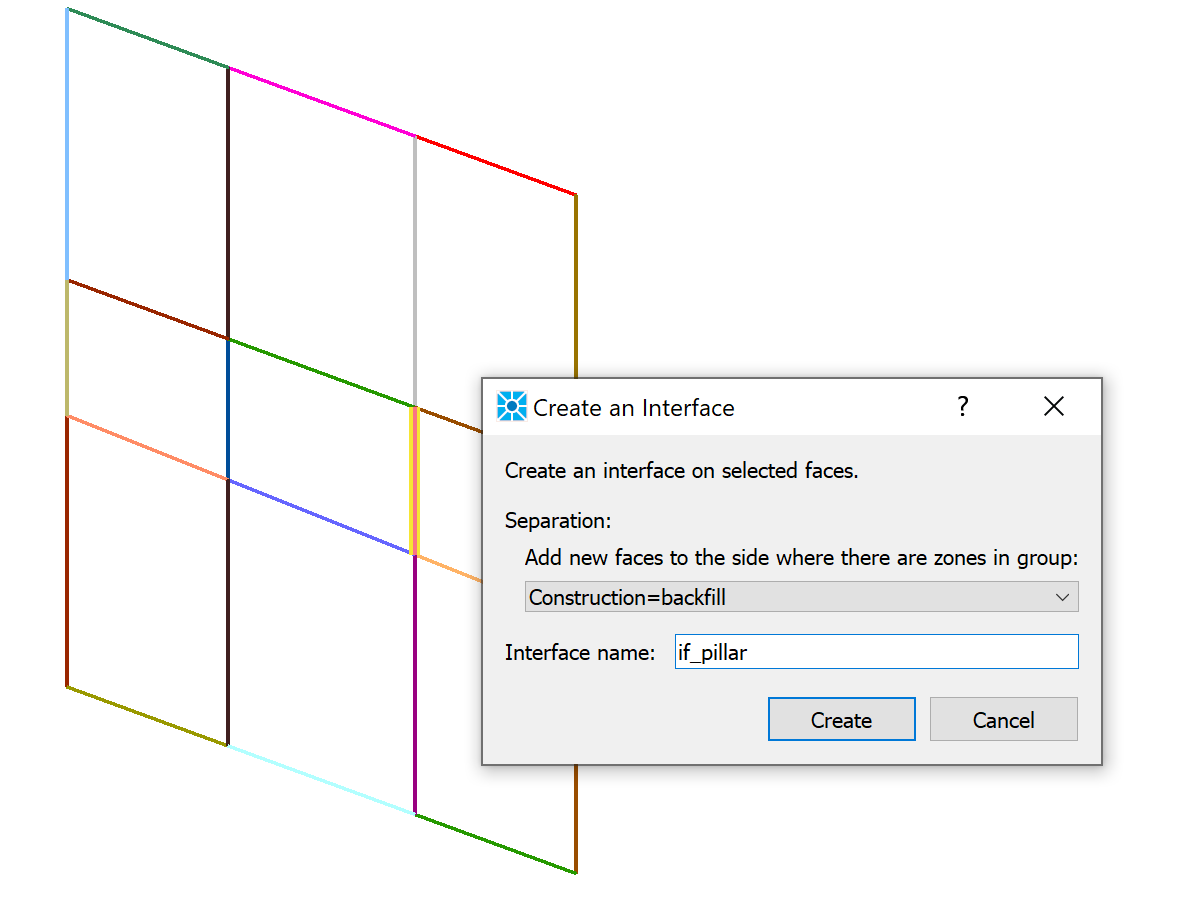
Figure 3: Interface creation dialog in the Model pane.
Repeat for the left side and assign the same interface name.
Select the face above the left part of the backfill. Create an interface on the side
Construction=backfilland name ithangingwall.Repeat for the face above the right part of the backfill (make sure to use group
Construction=backfill).Now choose the face directly above the pillar and create an interface on
Copnstruction=pillarand also name ithangingwall.Repeat the above steps for the three bottom faces, but name the interface
footwall.
The resulting interfaces are visible in Figure 2.
Material properties and constitutive models can also be assigned in the Model pane. The hangingwall and footwall are Elastic, the pillar is Strain-Softening material, and the backfill is assigned the Double-Yield model. The assigned properties are as shown in Table 2.
Model |
Initial Cohesion (MPa) |
Residual Cohesion (MPa) |
Initial Friction Angle |
Residual Friction Angle |
Tension (MPa) |
Bulk Modulus (GPa) |
Shear Modulus (GPa) |
Elastic (rock) |
3 |
2.3 |
|||||
Strain-softening (pillar) |
20 |
5 |
40 |
30 |
20 |
3 |
2.3 |
Double-Yield (backfill) |
0 |
0 |
40 |
40 |
0 |
0.45 |
0.6 |
Backfill in confined compression exhibits a pore-collapse behavior, as shown in Figure 4. The double-yield model in FLAC2D is used to model the backfill. The relation between cap pressure (\(c_p\)) and plastic volumetric strain (\(e^{pv}\)) is found by fitting a simple model to a uniaxial strain test on backfill (Clark 1991). (See Figure 4.) The relation found to fit the test is
A table of discrete values is calculated from this relation and used in the problem as shown in Table 3.
Strain, \(e^{pv}\) (%) |
Pressure, \(c_p\) (MPa) |
0 |
0.04 |
4 |
0.8 |
8 |
3.5 |
12 |
8.5 |
16 |
19.0 |
20 |
50.0 |
24 |
170.0 |
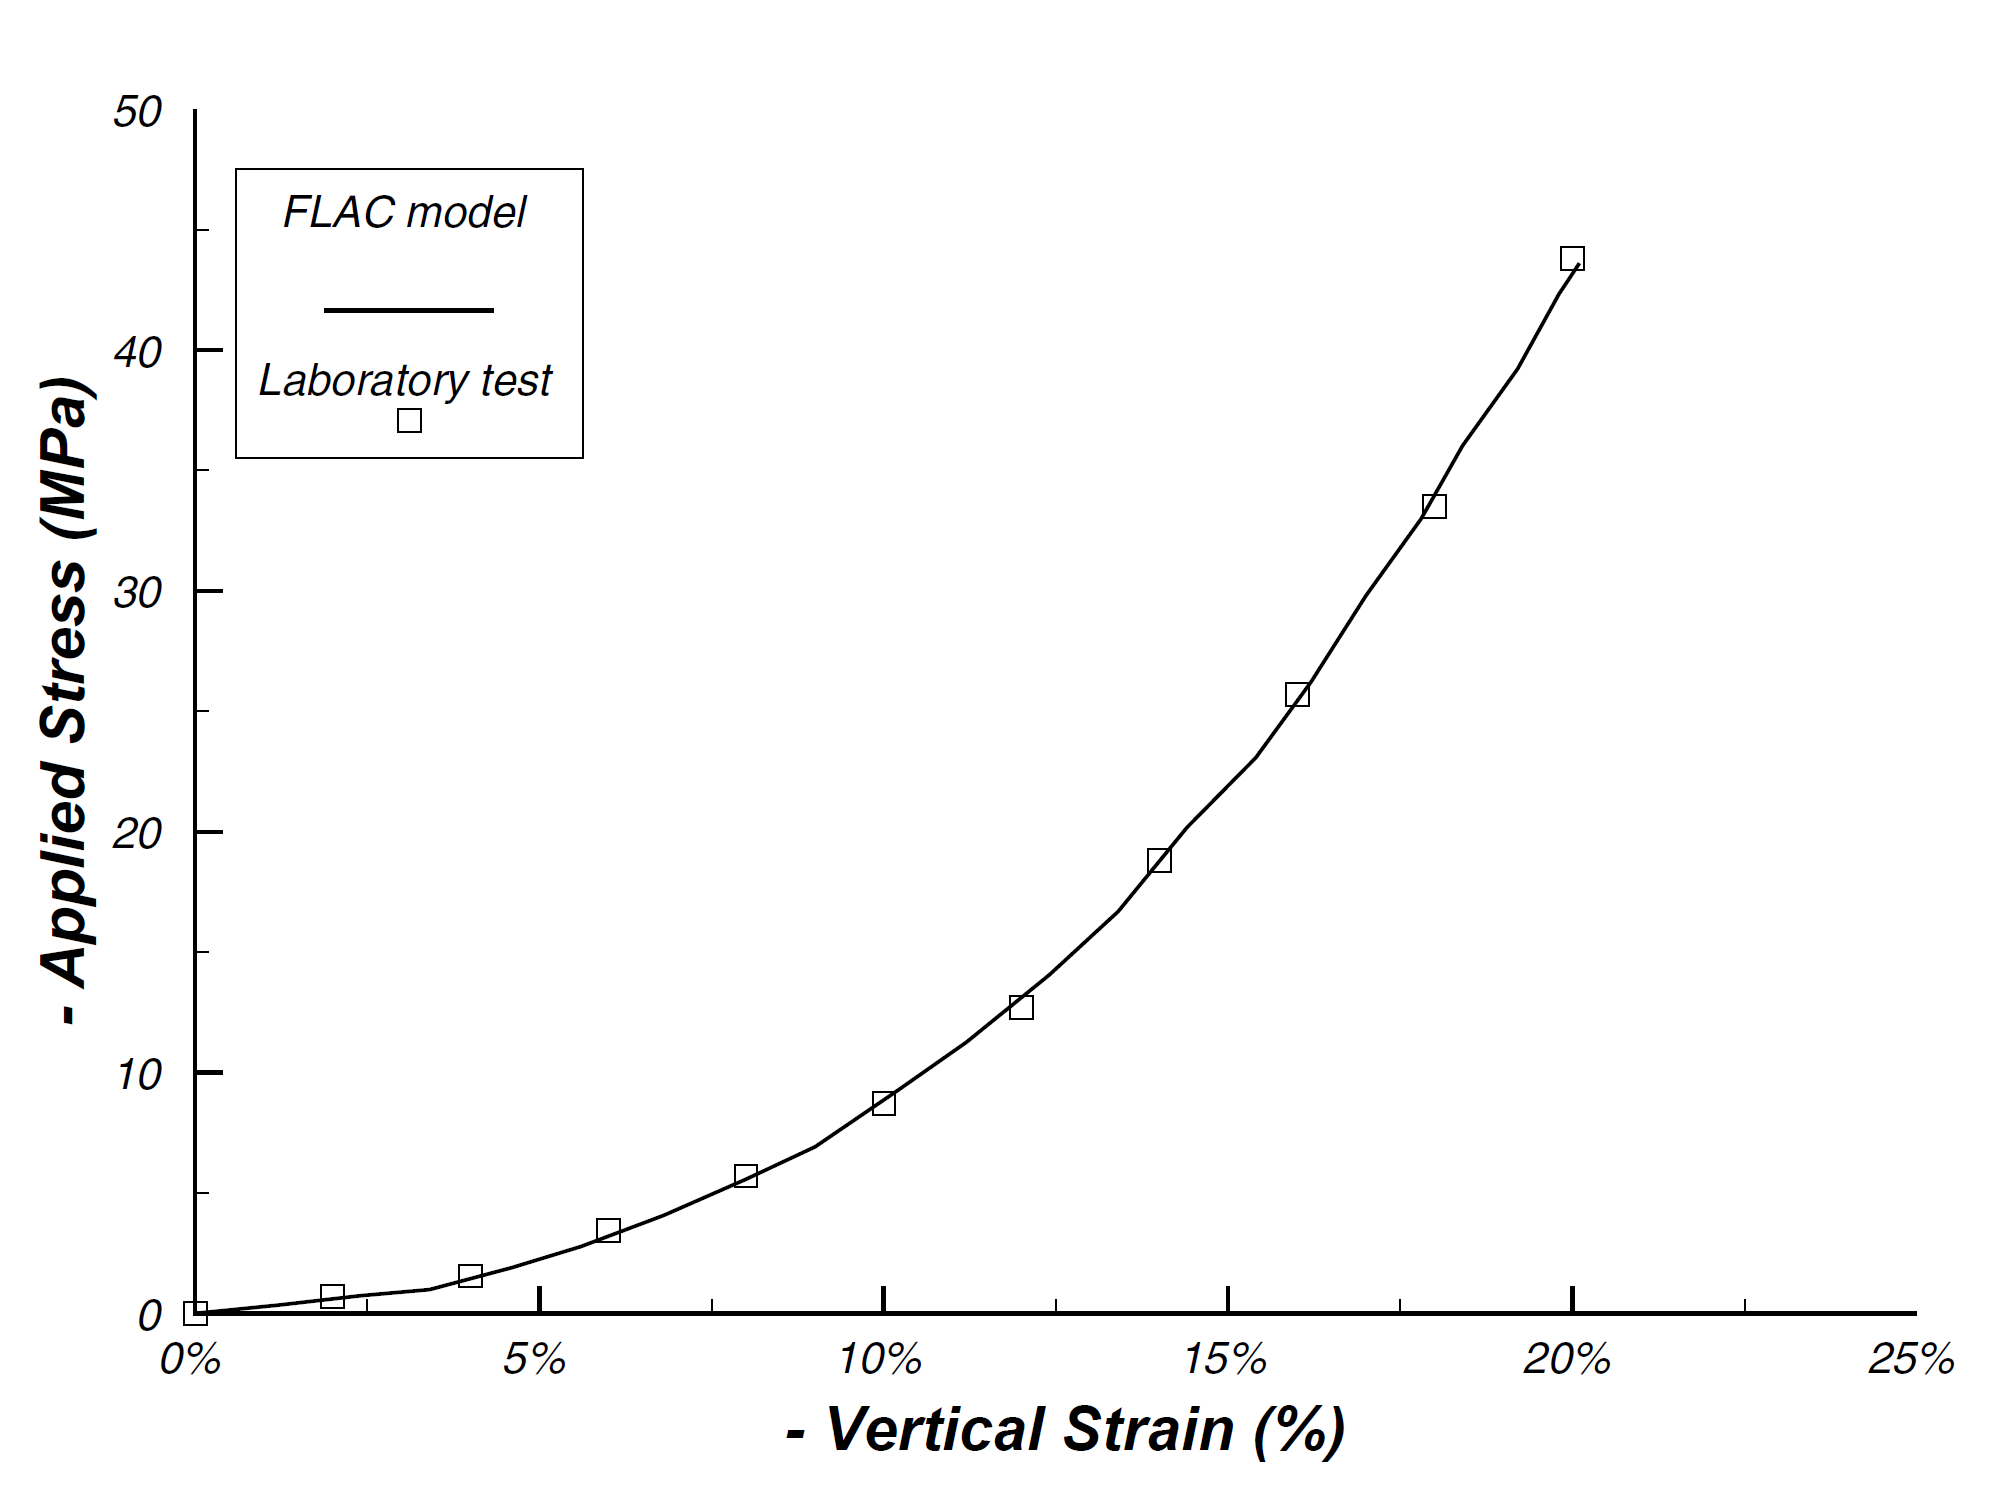
Figure 4: Comparison of experimental and FLAC-modeled uniaxial strain test (Clark, 1991).
The assigned interface properties are phi =20° and \(c\) = 0.1 MPa. Interface properties cannot be assigned in the Model workspace, and thus they are assigned with commands as shown in the data files at the end of this example.
The pillar is loaded by applying a negative \(y\)-velocity to the top boundary. FISH functions are used to monitor the pillar behavior. The stresses are obtained by averaging the values over all zones in the pillar, and the strains are obtained by averaging the relative displacement of gridpoints on the top and bottom of the pillar and dividing by the initial height (8 m).
Results
Note
The results shown here are slightly different than those of the equivalent model in FLAC 8.1. This is due to slight difference in interface formulation: in FLAC2D the interfaces are one-sided, whereas they are two-sided in FLAC 8.1.
Figures 5 through 7 show the plastic shear strain in the pillar for the three cases studied once a vertical strain of approximately 11% in the pillar is reached. In Case 1 (no backfill), a well-formed shear band crosses the pillar; this band is inhibited when the backfill is placed.
The vertical-stress versus the vertical-strain (both measured in the pillar) results are plotted for the three cases in Figure 8. The backfill has little effect on the peak strength, but it has a significant effect on the post-peak behavior due to an increase in confining stress. When backfill is present, the average pillar stress does not drop below 45 MPa, as opposed to a residual average stress of approximately 35 MPa with no backfill present. An expected delay in stress buildup in the pillar occurs for the case that includes a gap between roof and backfill.
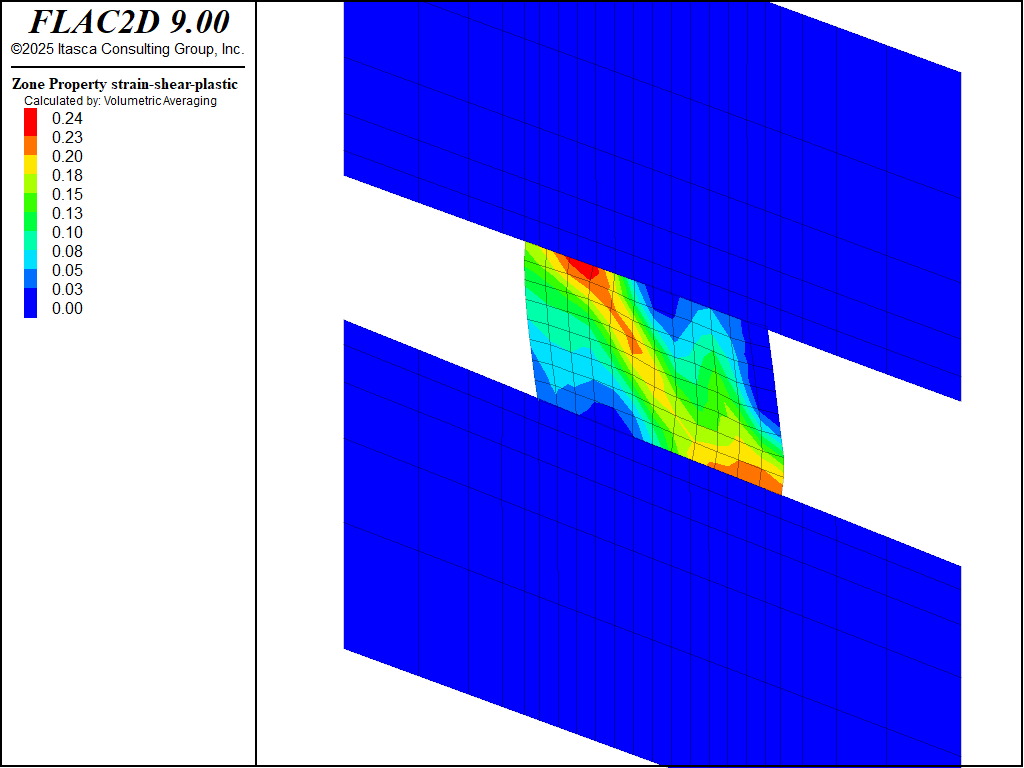
Figure 5: Plastic shear strain in pillar - Case 1.
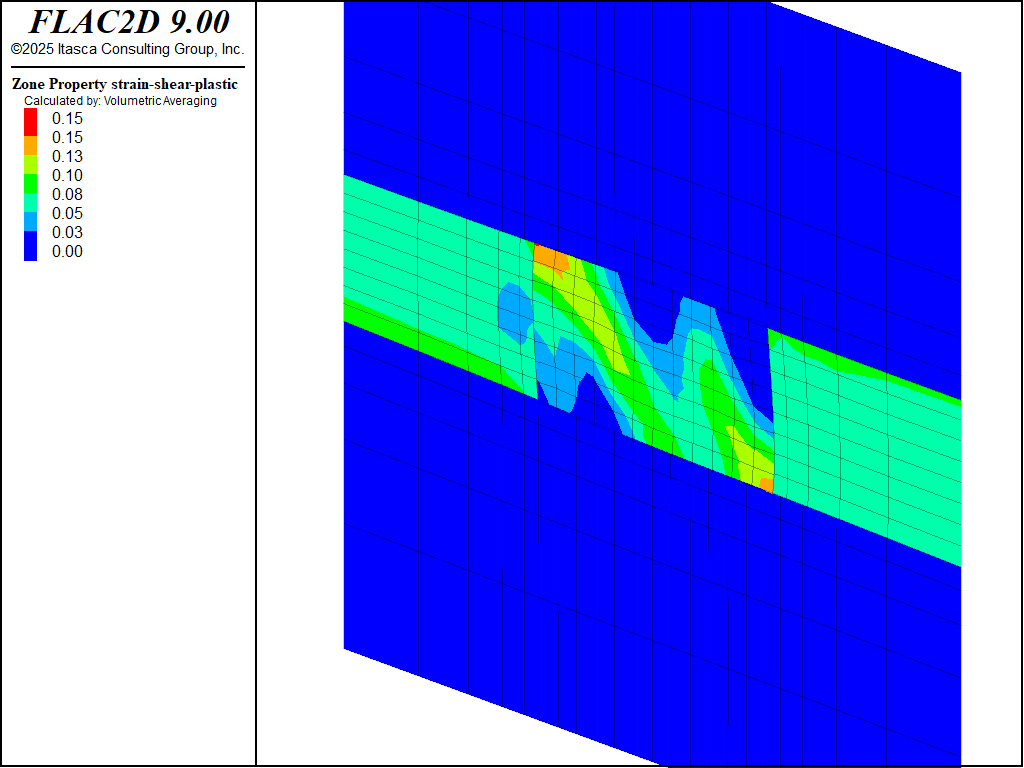
Figure 6: Plastic shear strain in pillar - Case 2.
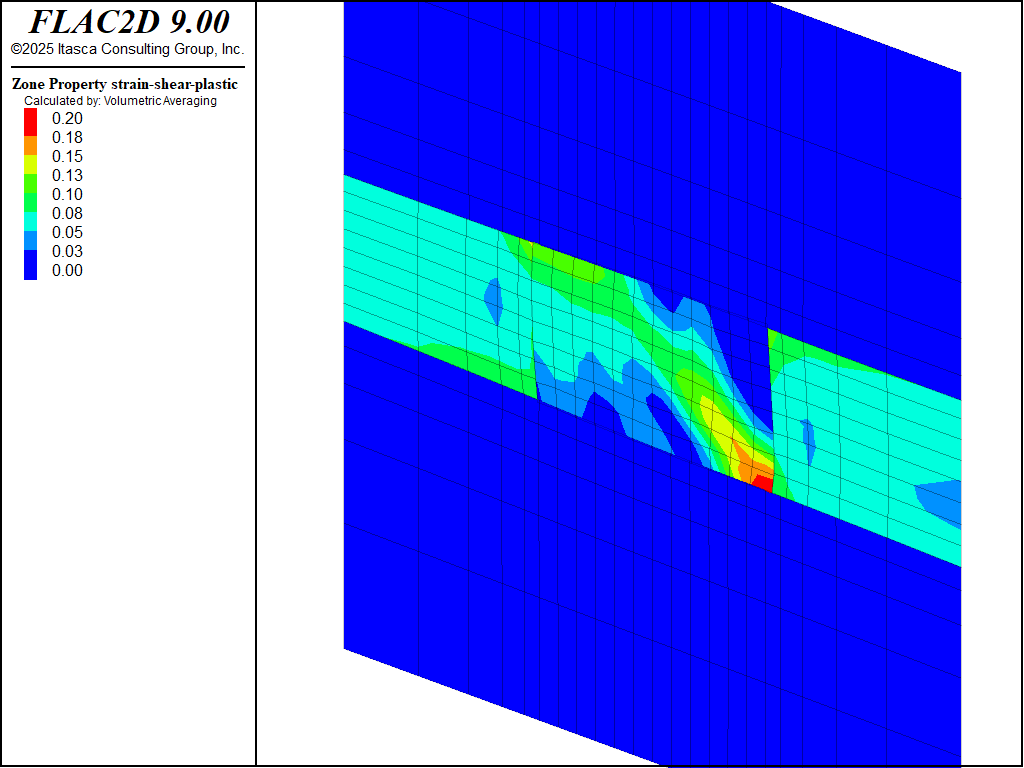
Figure 7: Plastic shear strain in pillar - Case 3.
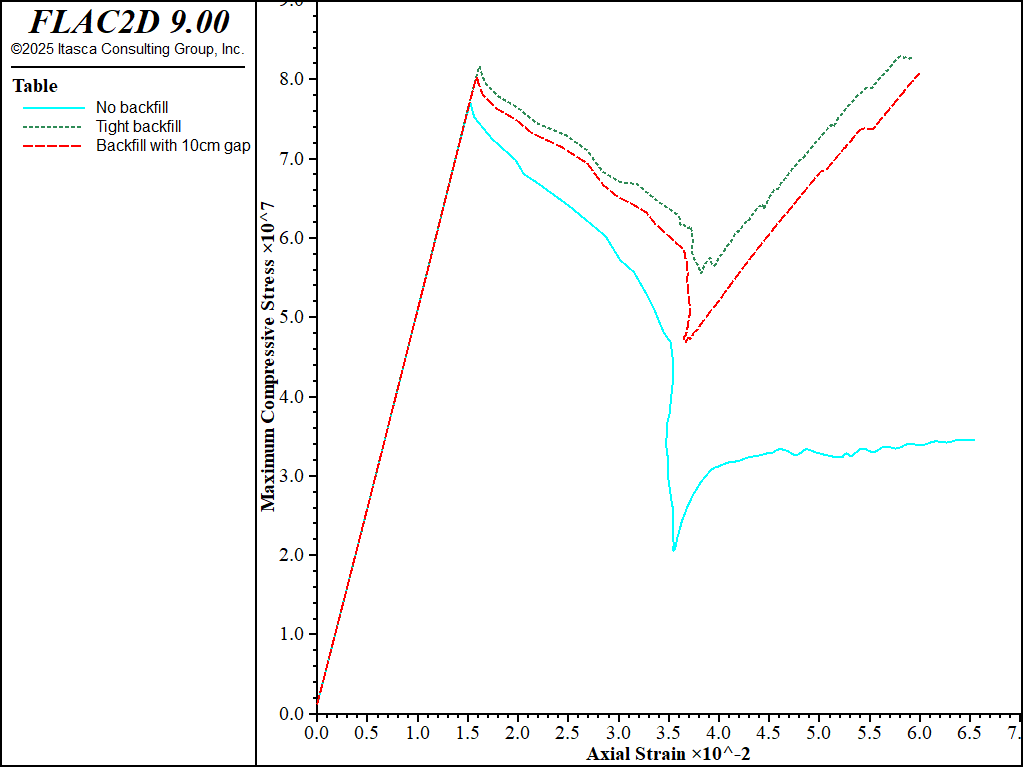
Figure 8: Maximum compressive stress versus vertical strain in the pillar.
Reference
Clark, I. H. “The Cap Model for Stress Path Analysis of Mine Backfill Compaction Processes,” in Computer Methods and Advances in Geomechanics (Proceedings of the 7th International Conference, Cairns, Australia, May 1991) , Vol. 2, pp. 1293-1298. Rotterdam: A. A. Balkema (1991).
Data File
initial.dat
; model geometry and material properties from Sketch and Model Pane
model new
program call 'model'

; interface properties
zone interface node property stiffness-normal 1e9 stiffness-shear 1e9 cohesion 1e5 friction 20

; strain softening tables

; strain-softening friction table
table '1' add 0,40 0.01,30 1,30

; strain-softening cohesion table
table '2' add 0,2e7 0.01,5e6 1,5e6

; double-yield cap-pressure table
table '3' add 0,1e4 0.02,2e5 0.04,8e5 0.06,1.3e6 0.08,3.5e6 0.1,5.5e6 ...
  0.12,8.5e6 0.14,1.15e7 0.16,1.9e7 0.18,3.4e7 0.2,5e7 0.22,8e7 0.24,1.7e8 0.26,5.4e8

; boundary conditions
zone face apply velocity-x 0 range position-x 0
zone face apply velocity-x 0 range position-x 30
zone face apply velocity 0 0 range group 'rockBottom1' or 'rockBottom2' or 'rockBottom3'

model gravity 9.81

; create list of zones in the pillar
[global pillar_zones = list(zone.list)(zone.isgroup(::zone.list, 'pillar'))]
[global num_pillar_zones = list.size(pillar_zones)]

; find gridpoints for measuring strain
[global top_left = gp.near(9.5,20.5,'pillar')]
[global bottom_left = gp.near(9.5,12.2,'pillar')]
[global top_right = gp.near(20.5,16.5,'pillar')]
[global bottom_right = gp.near(20.5,7.8,'pillar')]

; set up fish for recording stresses and strains
fish define eyy
  local height_left = gp.dis.y(top_left) - gp.dis.y(bottom_left)
  local height_right = gp.dis.y(top_right) - gp.dis.y(bottom_right)
   ; original height = 8
  eyy = 0.5*(height_left+height_right)/8.0
  s1 = list.sum(zone.stress.min(::pillar_zones))/num_pillar_zones
  s3 = list.sum(zone.stress.max(::pillar_zones))/num_pillar_zones
end

fish history name 'eyy' eyy
fish history name 's1' s1
fish history name 's3' s3

model save 'initial'
case1.dat
; Case 1 - no backfill

model restore 'initial'

zone cmodel assign null range group 'backfill'

model large-strain on
model solve elastic

zone gridpoint initialize displacement 0 0

history purge

zone face apply velocity-y -1e-4 range group 'rockTop1' or 'rockTop2' or 'rockTop3'

model cycle 10000

model save 'case1'

history export 's1' vs 'eyy' table 'case1'
table 'case1' export 'case1_s1.tab'
case2.dat
; Case 2 - tight backfill

model restore 'initial'

model large-strain on
model solve elastic

zone gridpoint initialize displacement 0 0

history purge

zone face apply velocity-y -1e-4 range group 'rockTop1' or 'rockTop2' or 'rockTop3'

model cycle 10000

model save 'case2'

history export 's1' vs 'eyy' table 'case2'
table 'case2' export 'case2_s1.tab'
case3.dat
; Case 3 - backfill with gap

model restore 'initial'

; create gap

zone gridpoint group 'top-backfill' range group 'hangingwall' group 'backfill'
fish define create_gap
  loop foreach local gp gp.list
    if gp.group(gp) = 'top-backfill'
      gp.pos.y(gp) -= 0.1
    endif
  end_loop
end
[create_gap]

model large-strain on
model solve elastic

zone gridpoint initialize displacement 0 0

history purge

zone face apply velocity-y -1e-4 range group 'rockTop1' or 'rockTop2' or 'rockTop3'

model cycle 10000

model save 'case3'

history export 's1' vs 'eyy' table 'case3'
table 'case1' import 'case1_s1.tab'
table 'case2' import 'case2_s1.tab'
Endnote
| Was this helpful? ... | Itasca Software © 2024, Itasca | Updated: Nov 12, 2025 |
